Shiken: JALT Testing & Evaluation SIG Newsletter
Vol. 14 No. 2. Oct. 2010. (p. 30 - 35) [ISSN 1881-5537]
PDF PDF Version

Statistics Corner
Questions and answers about language testing statistics:

How are PCA and EFA used
in language test and questionnaire development?

Photo of JD Brown, c. 2000
James Dean Brown
University of Hawai'i at Manoa


* QUESTION: In Chapter 7 of the 2008 book on heritage language learning that you co-edited with Kimi Kondo-Brown, there's a study (Lee & Kim, 2008) comparing the attitudes of 111 Korean heritage language learners. On page 167 of that book, a principal components analysis (with varimax rotation) describes the relation of examining 16 purported reasons for studying Korean with four broader factors. Several questions come to mind. What is a principal components analysis? How does principal components analysis differ from factor analysis? What guidelines do researchers need to bear in mind when selecting "factors"? And finally, what is a Varimax rotation and why is it applied?

* ANSWER: This is an interesting question, but a big one, made up of at least five sets of sub-questions: (a) What are principal components analysis (PCA) and exploratory factor analysis (EFA), how are they different, and how do researchers decide which to use? (b) How do investigators determine the number of components or factors to include in the analysis? (c) What is rotation, what are the different types, and how do researchers decide which to use? (d) How are PCA and EFA used in language research? And, (e) how are PCA and EFA used in language test and questionnaire development? I addressed the first four questions (a, b, c, & d) in previous columns (Brown, 2009a, b, c, 2010). I'll attend to the fifth one (e) here.
So how are PCA and EFA used in language test and questionnaire development? I have found at least three uses for these forms of analysis in developing my tests and questionnaires:
  1. Conducting item/subscale analysis to strengthen a test or questionnaire
  2. Studying the relative proportions of total, reliable, common, unique, specific, and error variances
  3. Providing evidence for convergent and discriminant validity
Let's consider each of these issues individually.

Conducting Item/Subscale Analysis to Strengthen a Test or Questionnaire

One use for PCA or EFA is to conduct item (or subscale) analysis with the goal of revising and strengthening a test or questionnaire. For example, notice in the first three columns of numbers in Table 1 (based on a set of data used in the previous column) that the Thinking extraversion variable is not loading in any meaningful way on either factor even though the questionnaire as a whole was designed to measure two clear sets of factors: extraversion (the first six variables) and neuroticism (the last six variables). Table 1 shows what happened when this set of data was analyzed with and without the Thinking extraversion variable.
Notice that the analysis with Thinking extraversion only accounts for 43.7 percent of the variance (see the bottom of the third column of numbers), while the analysis that left out Thinking extraversion accounts for 47.7% (see bottom of the sixth column of numbers). Thus when Thinking extraversion is eliminated, the subscales collectively are more clearly measuring extraversion and neuroticism (i.e., all subscales are loading more highly on one or the other of the extraversion factor or neuroticism factor) as predicted by theory. On the basis of this sort of analysis, researchers might choose to revise and improve the questionnaire so that it will work better with the particular group of respondents being studied.

[ p. 30 ]

Table 1. Two-Factor Factor Analysis (with Varimax rotation) of the Y/G Personality Inventory with and without Thinking Extraversion
Variables Rotated 2 Factors (with Thinking extraversion) Rotated 2 Factors (without Thinking extraversion)
Factor 1 Factor 2 h2 Factor 1 Factor 2 h2
Social extraversion -0.108 0.668 0.458 -0.142 0.660 0.456
Ascendance -0.086 0.553 0.314 -0.113 0.548 0.313
Thinking extraversion -0.064 -0.019 0.005
Rhathymia 0.405 0.573 0.493 0.381 0.596 0.501
General activity -0.191 0.692 0.515 -0.225 0.680 0.513
Lack of agreeableness 0.139 0.527 0.297 0.116 0.535 0.299
Lack of cooperativeness 0.468 0.013 0.219 0.468 0.036 0.220
Lack of objectivity 0.607 0.018 0.368 0.602 0.045 0.364
Nervousness 0.754 -0.199 0.608 0.762 -0.164 0.608
Inferiority feelings 0.656 -0.494 0.675 0.762 -0.164 0.608
Cyclic tendencies 0.792 0.077 0.633 0.786 0.114 0.677
Depression 0.773 -0.257 0.664 0.783 -0.221 0.662
Proportion of Variance 0.255 0.183 0.437 0.258 0.179 0.477

* Similarly, items can be the objects of this sort of analysis. For example, factor analysis can be used to identify items that are not loading heavily on the subtest into which they were designed to fit. There may be many reasons for such results, but nonetheless, such items are potentially measuring something different from the other items in the same subtest, so getting rid of these items and re-analyzing the data without them may be useful in revising whatever test or questionnaire is involved. In short, factor analysis can be used as a back-and-forth tool for eliminating items that don't work, and/or adding more items like the ones that do work, then re-administering the instrument and examining the degree to which the revised set of items is measuring what it was designed to measure.

Studying the Relative Proportions of Total, Reliable, Common, Unique, Specific, and Error Variances

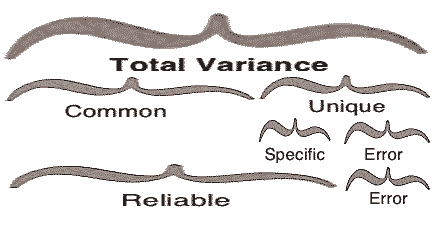
I'm assuming that everybody reading this column understands that test variance can be interpreted as including total variance, true score variance, and error variance (to review, see Brown, 2005, pp. 169-175). PCA and EFA can help us further understand the proportions of other sorts of variances in collections of variables, subtests, tests, subsections, or questionnaires (all referred to here as variables). More explicitly, PCA and EFA techniques can be used to examine the proportions of total variance, reliable variance, common variance, unique variance, specific variance, and error variance among variables within a test or questionnaire. Definitions of these concepts follow: The relationships among total, reliable, common, unique, specific, and error variances in PCA are shown in Figure 1.

Figure 1
Figure 1. Relationships among Total, Reliable, Common, Unique, Specific, and Error Variances in PCA
(adapted considerably from Rummel, 1970, p. 103)


PCA techniques can be used to estimate the proportions of common and unique variances within the total variance in set of variables. Let's start with common variance, that is, the variance that each variable shares with all the other variables. This common variance is known as the communality (symbolized by h2). For example, near the bottom of the third column of numbers in the PCA analysis shown in Table 2, you will see that the communality for Depression in bold italics is .711. That means that 71.1% of the variance in scores for that variable is common variance shared with the other variables in this analysis.
In PCA, unique variance is the variance that is due to a particular variable (including the specific variance and error variance associated with that variable), but does not include the variance shared with other variables. So unique variance equals one minus the communality (1 - h2). In the case of the Depression variable, the unique variance = 1 - h2 = 1 - .711 = .289. So 28.9% of the variance can be said to be unique to the Depression variable.


Table 2. Two-Component and Two-Factor Factor Analyses (with Varimax rotation) of the Y/G Personality Inventory without Thinking Extraversion
Variables Rotated PCA 2 Components Rotated EFA 2 Factors
Comp 1 Comp 2 h2 Factor 1 Factor 2 h2
Social extraversion -0.150 0.737 0.566 -0.142 0.660 0.456
Ascendance -0.116 0.654 0.441 -0.113 0.548 0.313
Rhathymia 0.419 0.656 0.605 0.381 0.596 0.501
General activity -0.238 0.740 0.605 -0.225 0.680 0.513
Lack of agreeableness 0.150 0.649 0.443 0.116 0.535 0.299
Lack of cooperativeness 0.565 0.065 0.065 0.468 0.036 0.220
Lack of objectivity 0.687 0.065 0.476 0.602 0.045 0.364
Nervousness 0.799 -0.170 0.668 0.762 -0.164 0.364
Inferiority feelings 0.703 -0.471 0.715 0.681 -0.462 0.608
Cyclic tendencies 0.819 0.117 0.684 0.786 0.114 0.677
Depression 0.812 -0.226 0.711 0.783 -0.221 0.662
Proportion of Variance 0.322 0.245 0.567 0.282 0.195 0.477

[ p. 32 ]

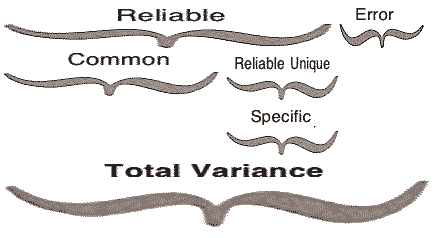
* Because EFA only analyzes reliable variance, it is useful for partitioning the proportions of reliable variance in a set of variables. Again, we will begin with common variance, in this case, the proportion of common variance that each variable shares with all the other variables. This common variance is called the communality and is symbolized by h2. For example, in bottom right corner of the EFA results in Table 2, the communality for the Depression is .662. That means that 66.2% of the reliable variance for that variable is common variance shared with other variables.
In the case of EFA, the reliable unique variance is the proportion of unique variance that is reliable in a particular variable, but does not include the variance shared with other variables. So the unique proportion of the reliable variance equals one minus the communality (1 - h2). In the case of the Depression variable, the reliable unique variance = 1 - h2 = 1 - .662 = .338. So 33.8% of the reliable variance can be said to be reliable and unique to the Depression variable.
Again, because only reliable variance is analyzed in EFA (in contrast to PCA, which analyzes all the variance), the reliable unique variance and specific variance are the same in EFA (Kline, 2000, p. 120) as shown in Figure 2 (for more on the differences between PCA and EFA, see Brown, 2009a). Therefore, because the reliable unique variance for the Depression variable is 33.8% (and the reliable unique variance = specific variance), the specific variance is also 33.8%. We can therefore say that about 23 of the reliable variance in Depression scores is common variance (when this variable is analyzed in this set of variables) and about 13 of the reliable variance is reliably unique (or specific) to the Depression scores.

Figure 2
Figure 2. Relationships among Total, Reliable, Common, Reliable Unique, Specific, and Error Variances in EFA

Do you see how all of this is useful information for thinking about our tests or questionnaires? We could just derive overall test or questionnaire reliability estimates using Cronbach alpha or other reliability estimates. But PCA can provide additional estimates of the proportions of common variance (71.1% for the Depression variable) and unique variance (28.9% for Depression). In addition, EFA can provide estimates of the proportions of common variance (62.2%) and reliable unique (or specific) variance (33.8%) . In other words, we now know that the Depression shares about 23 of its reliable variance with the other variables in the analysis, while 13 of the reliable variance in the Depression scale is reliably unique (or specific) to this particular scale.

[ p. 33 ]

In the next section, I will explain how language researchers often go on to further study the construct validity of their tests or questionnaires. [For more about these concepts and how to estimate each type of variance see Guilford, 1954, pp. 354-357; Magnusson, 1966, pp. 180-182; Gorsuch, 1983, pp. 26-33; or Kline, 2002, pp. 42-43.]

Providing Evidence for Convergent and Discriminant Validity

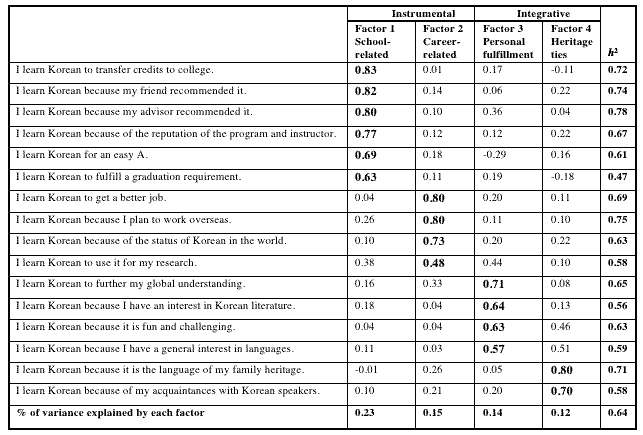
Coming back to the original question at the top of this paper, recall that Lee and Kim (2008) performed a PCA with Varimax rotation as shown in Table 3. Notice that the first six items load heavily on a Factor 1 (Instrumental School-Related), the next four items on Factor 2 (Instrumental Career-Related), the next four on Factor 3 (Integrative Personal Fulfillment), and the last two on Factor 4 (Heritage Ties). Loadings like these can serve as the basis for a convergent-discriminant validity argument. In this case, we can argue that the instrument is convergent (i.e., testing four constructs, or sub-constructs, with certain items converging together on each construct/factor) and discriminant (i.e., those same items are not loading as heavily on any other factors). Thus the item loadings provide support in real data for the validity of these four theoretical constructs.

Table 3. Principal Components Analysis (with Varimax Rotation) Loadings of Motivation Items
Table 3

Such an argument is undermined to the degree that there is complexity (i.e., items that load above say .30 on more than one factor) like that found in the 3rd , 10th , 11th , 13th , and 14th items. Indeed, the authors might choose to use this information to do item analysis (as explained above) by revising, replacing, or deleting the 3rd , 10th , 11th , 13th , and 14th items, administering the questionnaire again and reanalyzing the results in terms of the four sub-constructs.

Conclusion

[ p. 34 ]

* Many researchers use factor analysis for one purpose or another without realizing the rich variety of other purposes this form of analysis can serve. I showed in the previous column (Brown, 2010) that EFA and PCA have applications in research work that include at least reducing the number of variables in a study, exploring patterns in the correlations among variables, and supporting a theory of how variables are related. In this column, I expanded the list of uses for EFA and PCA by explaining how they can also be useful: for developing tests and questionnaires by conducting item analysis to strengthen them; for studying the relative proportions of total, reliable, common, unique, specific, and error variances; or for providing evidence for convergent and discriminent validity. If you are currently using EFA and PCA, consider expanding the ways you apply these analyses. If you are not currently using EFA and PCA, you might want to ask yourself, why not?

References

Brown, J. D. (2005). Testing in language programs: A comprehensive guide to English language assessment. New York: McGraw-Hill.

Brown, J. D. (2009a). Statistics Corner. Questions and answers about language testing statistics: Principal components analysis and exploratory factor analysis-Definitions, differences, and choices. Shiken: JALT Testing & Evaluation SIG Newsletter, 13 (1), 26-30. Also retrieved from the World Wide Web at http://http://jalt.org/test/bro_29.htm

Brown, J. D. (2009b). Statistics Corner. Questions and answers about language testing statistics: Choosing the right number of components or factors in PCA and EFA. Shiken: JALT Testing & Evaluation SIG Newsletter, 13 (2), 19 - 23. Also retrieved from the World Wide Web at http://http://jalt.org/test/bro_30.htm

Brown, J. D. (2009c). Statistics Corner. Questions and answers about language testing statistics: Choosing the right type of rotation in PCA and EFA. Shiken: JALT Testing & Evaluation SIG Newsletter, 13 (3), 20 - 25. Also retrieved from the World Wide Web at http://http://jalt.org/test/bro_31.htm

Brown, J. D. (2010). Statistics Corner. Questions and answers about language testing statistics: How are PCA and EFA used in language research? Shiken: JALT Testing & Evaluation SIG Newsletter, 14 (1). 19-23. Also retrieved from the World Wide Web at http://http://jalt.org/test/bro_32.htm

Gorsuch, R. L. (1983). Factor analysis (2nd ed.). Hillsdale, NJ: Lawrence Erlbaum Associates.

Guilford, J. P. (1954). Psychometric methods. New York: McGraw-Hill.

Kline, P. (2000). Handbook of psychological testing (2nd ed.). New York: Routledge.

Kline, P. (2002). An easy guide to factor analysis. London: Routledge.

Lee, J. S., & Kim, H. Y. (2008). Heritage language learners' attitudes, motivations, and instructional needs: The case of postsecondary Korean language learners. In K. Kondo-Brown & J. D. Brown (Eds.), Teaching Chinese, Japanese, and Korean heritage language students. New York: Lawrence Erlbaum Associates.

Magnusson, D. (1966). Test theory. Reading, MA: Addison-Wesley.

Rummel, R. J. (1970). Applied factor analysis. Evanston, IL: Northwestern University.


NEWSLETTER: Topic IndexAuthor IndexTitle IndexDate Index
TEVAL SIG: Main Page Background Links Network Join

STATISTICS CORNER ARTICLES:
#1   #2   #3   #4   #5   #6   #7   #8   #9   #10   #11   #12   #13   #14   #15   #16  
#17   #18   #19   #20   #21   #22   #23   #24   #25   #26   #27   #28   #29   #30   #31   #32   #33   #34  

last Main Page next
HTML: http://jalt.org/test/bro_33.htm   /   PDF: http://jalt.org/test/PDF/Brown33.pdf

[ p. 35 ]