Shiken: JALT Testing & Evaluation SIG Newsletter
Vol. 5 No. 1. April 2001. (p. 15 - 19) [ISSN 1881-5537]
PDF PDF Version

Statistics Corner
Questions and answers about language testing statistics:

What is an eigenvalue?

Photo of JD Brown, c. 2000
James Dean Brown
University of Hawai'i at Manoa


* QUESTION: One statistic that I see a lot in articles reporting testing research is the eigenvalue. What is this for?

* ANSWER: In language testing articles, eigenvalues are most commonly reported in factor analyses. They are calculated and used in deciding how many factors to extract in the overall factor analysis. To adequately explain the use of eigenvalues within the context of factor analysis, I will need to address several questions: (a) What is factor analysis? (b) How is factor analysis used in language testing? And, (c) how should we decide on the number of factors to use in a factor analysis?

What is Factor Analysis?

The purpose of factor analysis is to "explore the underlying variance structure of a set of correlation coefficients. Thus, factor analysis is useful for exploring and verifying patterns in a set of correlation coefficients. . . " (Brown, 2001, p. 184). If the analysis is designed to account for only the variance in the correlation coefficients and ignore the error variance (i.e., the variance not accounted for by the correlation coefficients), it is called a factor analysis. If the analysis is designed to account for all of the variance including that found in the correlation coefficients and error variance, it is called a principal components analysis. In both cases, the analysis calculates factors that underlie the correlations involved.
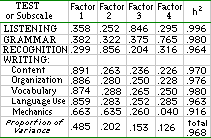
One such analysis is shown in Table 1 for the 1998 and 1999 Japanese Placement Test at the University of Hawai'i (as reported in Kondo-Brown & Brown, 2000) including four tests: Listening, Grammar, Recognition (of kanji and kana characters), and Writing (with five subtests: Content, Organization, Vocabulary, Language Use, and Mechanics). A total of 939 students took the Listening test, 1294 took the Grammar test, 1124 took the Recognition test, and 428 students took the Writing test.
While conducting the initial analysis, we decided to use one factor because only one factor had an eigenvalue of 1.00 or higher. The loadings (i.e., the correlations of each of the tests in the study with the factor) shown in the first column of numbers indicate that the Listening test scores are correlated with the single factor at .788, the Grammar test at .818, etc. The communalities (h2) (i.e., the total proportion of variance that the analysis accounts for in each test) shown in the column to the right indicate that the proportion of variance accounted for in the Listening test scores is .601 (or 60.1%), the total variance accounted for in the Grammar scores is 66.9%, etc. The figures at the bottom of the table in italics indicate that the proportion of variance accounted for by Factor 1 in this validity study was .789 (or 78.9%), and because there is only one factor, the total proportion of variance is the same.

[ p. 15 ]


Table 1. Results of Principal Components Analysis of
the Japanese Placement Tests
at the University of Hawai'i
(from Kondo-Brown & Brown, 2000)


If the analysis stopped with the information shown in Table 1, it would appear that the eight tests and subtests are all loading on the same factor and therefore are all measuring about the same thing. However, because the analysis only accounted for 78.9% of the variance, we went a bit further, as I will explain momentarily.

How is Factor Analysis Used in Language Testing?

One way that factor analysis is used in language testing is to study construct validity (as suggested in Bachman, 1990, pp. 262-263, and Brown, 1996, p. 246 or 1999, p. 281). If a series of tests are administered to a group of students and those tests that logically should be related turn out to load on the same factor, while tests that would logically be less related load on different factors, the analysis can be used to argue for the convergent validity (i.e., the similar tests load together) and divergent validity (the unrelated tests load separately). For example, Table 2 shows a four-factor analysis of the same data analyzed in Table 1. Notice that the loadings indicate that the Writing subtest scores (Content, Organization, Vocabulary, Language Use, & Mechanics) are fairly highly correlated with Factor 1 (at .891, .886, .874, .859 & .663, respectively), while the Recognition test scores correlate at .856 with Factor 2, the Listening test scores correlate at .848 with Factor 3, and the Grammar test scores correlate at .768 with Factor 4. At the same time, the communalities show that this analysis accounts for between 91.6% to 99.8% of the variance in each of the eight tests/subtests, with an average of 96.8%. The figures at the bottom of the table in italics indicate Factor 1 in this validity study accounts for .485 (or 48.5%) of the variance in these tests/subtests, Factor 2 accounts for 20.2%, Factor 3 accounts for 15.3%, and Factor 4 accounts for 12.8%, for a total of 96.8% of the variance accounted for.

[ p. 16 ]


Table 2. Results of the Four Factor Analysis After Varimax Rotation - Revised Versions


The general pattern here is that the five subtests of the Writing test load together (supporting convergent validity), while each of the other tests load most heavily on a different factor (supporting divergent validity). Notice, however, that the Mechanics subtest of the Writing test also loads fairly heavily on Factor 2 (at .636) along with the Recognition test (at .856). Since both Mechanics and Recognition are very much about kana/kanji character reading or writing, the fact that they load together makes sense in this pattern of results. Naturally, an accumulation of other types of validity evidence would make the overall validity arguments stronger.

How Should We Decide on the Number of Factors to Use in a Factor Analysis?

In the example analyses above, Tables 1 and 2 showed very different patterns of results. Obviously then, the number of factors you choose in doing such analyses can noticeably affect the resulting patterns. A number of approaches can be used for deciding on the number of factors to include in a factor analysis (see, for instance, Gorsuch, 1983, pp. 164-171) and the choice of approach can definitely affect the results and their credibility. Four common approaches are to:
  1. Select the number of factors with eigenvalues of 1.00 or higher
  2. Examine a scree plot of eigenvalues plotted against the factor numbers
  3. Analyze increasing numbers of factors; stop when all non-trivial variance is accounted for
  4. Use the number of factors that your theory would predict
Selecting factors with eigenvalues of 1.00 or higher. The first approach is to select the number factors with eigenvalues of 1.00 or higher. This approach is the default for most statistical programs (e.g., SPSS, StatView, SYSTAT, etc.), which probably explains why you have often encountered this statistic in discussions of factor analyses. Indeed, it is this approach that was used in the analysis shown in Table 1.

[ p. 17 ]


Figure 1. Scree plot for the analysis shown in Table 1


In direct answer to your question, in matrix algebra, under certain conditions, matrices can be diagonalized. Matrices are often diagonalized in multivariate analyses. In that process, eigenvalues are used to consolidate the variance. In factor analysis, eigenvalues are used to condense the variance in a correlation matrix. "The factor with the largest eigenvalue has the most variance and so on, down to factors with small or negative eigenvalues that are usually omitted from solutions" (Tabachnick and Fidell, 1996, p. 646). From the analyst's perspective, only variables with eigenvalues of 1.00 or higher are traditionally considered worth analyzing. However, the other three approaches explained below can provide overriding reasons for selecting other numbers of factors (see Gorsuch, 1983, pp. 164-171).

Examining a scree plot. The second approach that is commonly used is to examine a scree plot of the eigenvalues plotted against the factor numbers. A scree plot for the data analyzed in Tables 1 and 2 is presented in Figure 1. [Notice that the scree plot looks a bit like a pile of rocks and debris at the bottom of a cliff, which is one geological definition of scree.] A scree plot is typically interpreted as follows: the number of factors appropriate for a particular analysis is the number of factors before the plotted line turns sharply right. Thus the scree plot shown in Figure 1 supports our earlier one-factor choice.

Analyzing non-trivial variance. A third approach is to investigate increasing numbers of factors and stop when all non-trivial amounts of variance are accounted for. In fact, in arriving at the four-factor analysis, we first did the one-factor analysis, then a two-factor analysis and a three-factor analysis, ending with the four-factor analysis shown in Table 2 (to see the intermediary two-factor and three-factor analyses, see Kondo-Brown & Brown, 2000). At each step, we examined the amounts of variance accounted for and found them to be non-trivial (the smallest was 12.8%).

[ p. 18 ]

Using a theory-based approach. The fourth approach discussed here is to use the number of factors that your theory would predict. The simplest theory of the structure of the variance in the example data shown here would be that each test would be relatively independent (because they are designed to test different skills involved in overall Japanese language ability). At the same time, any such theory would predict that the subtests of the Writing test would be relatively similar. Thus one factor for each of the four tests would make the most sense theoretically. Since each of the four factors contributes non-trivial amounts of variance and fits a logical theory for these data, we had two reasons for accepting a four-factor solution.

Conclusion

Clearly, my answer to your question was fairly complicated. I first had to explain what factor analysis is, how factor analysis is commonly used in language testing, and how eigenvalues fit into the overall picture of deciding on the number of factors to use in such an analysis. Naturally, much more could be said about factor analysis. If you are interested in reading more on this topic, I would highly recommend starting with the clearly written and concise chapter in Tabachnick and Fidell (1996). For another overview of factor analysis and validity concepts (on the Internet), see Stapleton, 1997. Nonetheless, I hope that this brief overview has at least satisfied your curiosity about what eigenvalues are used for.

References

Bachman, L. F. (1990). Fundamental considerations in language testing. Oxford: Oxford University Press.

Brown, J. D. (1996). Testing in language programs. Upper Saddle River, NJ: Prentice Hall.

Brown, J. D. [trans. by M. Wada]. (1999). Gengo tesuto no kisochishiki. [Basic knowledge of language testing]. Tokyo: Taishukan Shoten.

Brown, J. D. (2001). Using surveys in language programs. Cambridge: Cambridge University Press.

Kondo-Brown, K., & Brown, J. D. (2000). The Japanese Placement Tests at the University of Hawai'i: Applying item response theory. (NFLRC NetWork #20). Honolulu: University of Hawai'i, Second Language Teaching & Curriculum Center. Retrieved April 15, 2001 from www.LLL.hawaii.edu/nflrc/NetWorks/NW20/ [Expired Link]

Gorsuch, R. L. (1983). Factor analysis (2nd ed.). Hillsdale, NJ: Lawrence Erlbaum Associates.

Tabachnick, B. G., & Fidell, L. S. (1996). Using multivariate statistics (3rd Ed.). New York: Harper Collins.

Stapleton, C. D. (n.d.). Basic concepts in exploratory factor analysis (EFA) as a tool to evaluate score validity: A right-brained approach. Texas A& M University. Retrieved April 15, 2001 from http://searcheric.org/ericdb/ED407416.htm

NEWSLETTER: Topic IndexAuthor IndexTitle IndexDate Index
TEVAL SIG: Main Page Background Links Network Join
STATISTICS CORNER ARTICLES:

#1   #2   #3   #4   #5   #6   #7   #8   #9   #10   #11   #12   #13   #14   #15   #16   #17   #18   #19   #20   #21   #22   #23   #24   #25   #26   #27   #28   #29   #30   #31   #32   #33   #34  
last Main Page next
HTML: http://jalt.org/test/bro_10.htm   /   PDF: http://jalt.org/test/PDF/Brown10.pdf

[ p. 19 ]