Shiken:JALT Testing & Evaluation SIG Newsletter
Vol. 7 No. 2. Jun. 2003. (p. 18 - 20) [ISSN 1881-5537]
PDF PDF Version

Statistics Corner
Questions and answers about language testing statistics:

Norm-referenced item analysis
(item facility and item discrimination)

Photo of JD Brown, c. 2000
James Dean Brown
University of Hawai'i at Manoa


* QUESTION: A few years ago in your Shiken column, you showed how to do item analysis for weighted items using a calculator (Brown, 2000, pp. 19-21) and a couple of columns back (Brown, 2002, pp. 20-23) you showed how to do distractor efficiency analysis in a spreadsheet program. But, I don't think you have ever shown how to do regular item analysis statistics in a spreadsheet. Could you please do that? I think some of your readers would find it very useful.

* ANSWER: Yes, I see what you mean. In answering questions from readers, I explained more advanced concepts of item analysis without laying the groundwork that other readers might need. To remedy that, in this column, I will directly address your question, but only with regard to norm-referenced item analysis. In my next Statistics Corner column, I will address another reader's question, and in the process show how criterion-referenced item analysis can be done in a spreadsheet.

The Overall Purpose of Item Analysis

Let's begin by answering the most basic question in item analysis: Why do we do item analysis? We do it as the penultimate step in the test development process. Such projects are usually accomplished in the following steps:
  1. Assemble or write a relatively large number of items of the type you want on the test.
  2. Analyze the items carefully using item format analysis to make sure the items are well written and clear (for guidelines, see Brown, 1996, 1999; Brown & Hudson, 2002).
  3. Pilot the items using a group of students similar to the group that will ultimately be taking the test. Under less than ideal conditions, this pilot testing may be the first operational administration of the test.
  4. Analyze the results of the pilot testing using item analysis techniques. These are described below for norm-referenced tests (NRTs) and in the next column for criterion-referenced tests (CRTs).
  5. Select the most effective items (and get rid of the ineffective items) to make a shorter, more effective revised version of the test.
Basically, those five steps are followed in any test development or revision project.

[ p. 16 ]

Item Analysis Statistics for Norm-Referenced Tests

As indicated above, the fourth step, item analysis, is different for NRTs and CRTs, and in this column, I will only explain item analysis statistics as they apply to NRTs. The basic purpose of any NRT is to spread students out along a general continuum of language abilities, usually for purposes of making aptitude, proficiency, or placement decisions (for much more on this topic, see Brown, 1996, 1999; Brown & Hudson, 2002). Two item statistics are typically used in the item analysis of such norm-referenced tests: item facility and item discrimination.
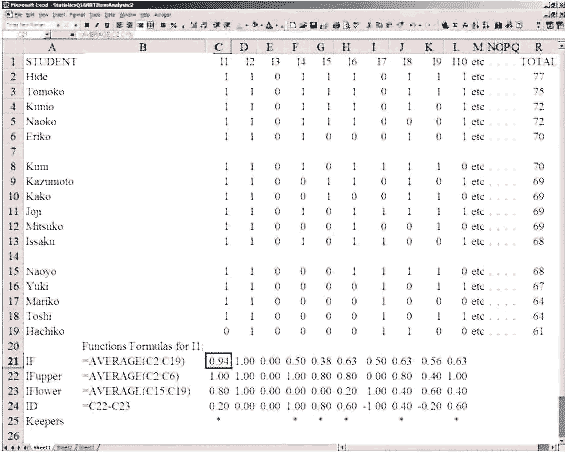
Item facility (IF) is defined here as the proportion of students who answered a particular item correctly. Thus, if 45 out of 50 students answered a particular item correctly, the proportion would be 45/50 = .90. An IFof .90 means that 90% of the students answered the item correctly, and by extension, that the item is very easy. In Screen 1, you will see one way to calculate IFusing the Excel® spreadsheet for item 1 (I1) in a small example data set coded 1 for correct and 0 for incorrect answers. Notice the cursor has outlined cell C21 and that the function/formula typed in that cell (shown both in the row above the column labels and in cell B21) is = AVERAGE (C2:C19), which means average the ones and zeros in the range between cells C2 and C19. The result in this case is .94, a very easy item because 94% of the students are answering correctly.
Screen 1: The NRT Item Analysis


All the other NRT and CRT item analysis techniques that I will discuss here and in the next column are based on this notion of item facility. For instance, item discrimination can be calculated by first figuring out who the upper and lower students are on the test (using their total scores to sort them from the highest score to the lowest). The upper and lower groups should probably be made up of equal numbers of students who represent approximately one third of the total group each. In Screen 1, I have sorted the students from high to low based on their total test scores from 77 for Hide down to 61 for Hachiko. Then I separated the three groups such that there are five in the top group, five in the bottom group, and six in the middle group. Notice that Issaku and Naoyo both had scores of 68 but ended up in different groups (as did Eriko and Kimi with their scores of 70). The decision as to which group they were assigned to was made with a coin flip.

[ p. 18 ]


To calculate item discrimination (ID), I started by calculating IFfor the upper group using the following: = AVERAGE(C2:C6), as shown in row 22. Then, I calculated IFfor the lower group using the following: = AVERAGE(C15:C19), as shown in row 23. With IFupper and IFlower in hand, calculating IDsimply required subtracting IFupper - IFlower. I did this by subtracting C22 minus C23, or = C22 - C23, as shown in row 24, which resulted in an IDof .20 for I1.
Once I had calculated the four item analysis statistics shown in Screen 1 for I1, I then simply copied them and pasted them into the spaces below the other items, which resulted in all the other item statistics you see in Screen 1. [Note that the statistics didn't always fit in the available spaces, so I got results that looked like ### in some cells; to fix that, I blocked out all the statistics and typed alt oca and thus adjusted the column widths to fit the statistics. You may also want to adjust the number of decimal places, which is beyond the scope of this article. You can learn about this by looking in the Help menu or in the Excel manual.
Ideal items in an NRT should have an average IFof .50. Such items would thus be well centered, i.e., 50 percent of the students would have answered correctly, and by extension, 50 percent would have answered incorrectly. In reality however, items rarely have an IFof exactly .50, so those that fall in a range between .30 and .70 are usually considered acceptable for NRT purposes.
Once those items that fall within the .30 to .70 range of IFs are identified, the items among them that have the highest IDs should be further selected for inclusion in the revised test. This process would help the test designer to keep only those items that are well centered and discriminate well between the high and the low scoring students. Such items are indicated in Screen 1 by an asterisk in row 25 (cleverly labeled "Keepers").
For more information on using item analysis to develop NRTs, see Brown (1995, 1996, 1999). For information on calculating NRT statistics for weighted items (i.e., items that cannot be coded 1 or 0 for correct and incorrect), see Brown (2000). For information on calculating item discrimination using the point-biserial correlation coefficient instead of ID, see Brown (2001). For an example NRT development and revision project, see Brown (1988).

[ p. 19 ]

Conclusion

I hope you have found my explanation of how to do norm-referenced item analysis statistics (item facility and item discrimination) in a spreadsheet clear and helpful. I must emphasize that these statistics are only appropriate for developing and analyzing norm-referenced tests, which are usually used at the institutional level, like, for example, overall English language proficiency tests (to help with, say, admissions decisions) or placement tests (to help place students into different levels of English study within a program). However, these statistics are not appropriate for developing and analyzing classroom oriented criterion-referenced tests like the diagnostic, progress, and achievement tests of interest to teachers. For an explanation of item analysis as it is applied to CRTs, read the Statistics Corner column in the next issue of this newsletter, where I will explain the distinction between the difference index and the B-index.

References

Brown, J. D. (1988). Tailored cloze: Improved with classical item analysis techniques. Language Testing, 5 (1), 19-31.

Brown, J. D. (1995). Developing norm-referenced language tests for program-level decision making. In J. D. Brown & S.O. Yamashita (Eds.). Language Testing in Japan (pp. 40-47). Tokyo: Japan Association for Language Teaching.

Brown, J. D. (1996). Testing in language programs. Upper Saddle River, NJ: Prentice Hall.

Brown, J. D. (trans. by M. Wada). (1999). Gengo tesuto no kisochishiki [Basic knowledge of language testing]. Tokyo: Taishukan Shoten.

Brown, J. D. (2000). Statistics Corner. Questions and answers about language testing statistics (How can we calculate item statistics for weighted items?). Shiken: JALT Testing & Evaluation SIG Newsletter, 3 (2), 19-21. Retrieved from the World Wide Web at http://jalt.org/test/bro_6.htm on 15 April 2003.

Brown, J. D. (2001). Statistics Corner. Questions and answers about language testing statistics (What is a point-biserial correlation coefficient?). Shiken: JALT Testing & Evaluation SIG Newsletter, 5 (3), 12-15. Retrieved from the World Wide Web at http://jalt.org/test/bro_12.htm on 15 April 2003.

Brown, J. D. (2002). Statistics Corner. Questions and answers about language testing statistics (Distractor efficiency analysis on a spreadsheet). Shiken: JALT Testing & Evaluation SIG Newsletter, 6 (3), 20-23. Retrieved from the World Wide Web at http://jalt.org/test/bro_15.htm on 15 April 2003.

Brown, J. D., & Hudson, T. (2002). Criterion-referenced language testing. Cambridge: Cambridge University Press.


NEWSLETTER: Topic IndexAuthor IndexTitle IndexDate Index
TEVAL SIG: Main Page Background Links Network Join
STATISTICS CORNER ARTICLES:

#1   #2   #3   #4   #5   #6   #7   #8   #9   #10   #11   #12   #13   #14   #15   #16   #17   #18   #19   #20   #21   #22   #23   #24   #25   #25   #26   #27   #28   #29   #30   #31   #32   #33   #34  
last Main Page next
HTML: http://jalt.org/test/bro_17.htm   /   PDF: http://jalt.org/test/PDF/Brown17.pdf

[ p. 20 ]