Shiken: JALT Testing & Evaluation SIG Newsletter
Vol. 14 No. 2 Oct. 2010 (p. 23 - 29) [ISSN 1881-5537]
PDF PDF Version

Rasch Measurement in language education Part 5:
Assumptions and requirements of Rasch measurement

James Sick, Ed.D. (International Christian University, Tokyo)


Previous installments of this series provided an overview of Rasch measurement theory, discussed the differences among the various Rasch models, and compared Rasch theory with classical true score theory and item response theory (IRT). In this installment, I will discuss some assumptions and requirements that underlie Rasch measurement theory, leading to a more detailed examination of the differences in approach between Rasch and 2- and 3- parameter IRT.

* QUESTION: I recently came across a posting on a statistics forum stating that #Rasch modeling makes very strong assumptions about the behavior of your items. It is a strong measurement model for use when you really need interval level measurement and are willing to sacrifice items and even eliminate persons from your data (Gambrell, 2010, June 14). My statistics advisor has also warned me that the assumptions of Rasch modeling – unidimensionality, equal item discrimination, and low susceptibility to guessing – are often impossible to meet with real-world data. Can you elaborate on how we should test these assumptions in order to determine whether it is appropriate to apply the Rasch model to a dataset?

"[Unidimensionality, equal item discrimination, and low susceptibility to guessing] are not characteristics of a dataset that are assumed to be true . . . [they] are ideals that must be reasonably approximated . . . Real world data are not expected to match the [Rasch] model perfectly."

* ANSWER: Although unidimensionality, equal item discrimination, and no error due to guessing are sometimes stated as "assumptions" of the Rasch model, Rasch measurement theorists view these properties not as assumptions of the model, but as requirements of rigorous, fundamental measurement. The Rasch model merely provides a mathematical formulation of these fundamental properties that can be used to evaluate a dataset. Put another way, from the perspective of Rasch measurement theory these are not characteristics of a dataset that are assumed to be true, or that must be verified prior to conducting a Rasch analysis. They are ideals that must be reasonably approximated if the data are to be employed to construct high quality measures of a latent variable. This subtle difference in viewpoint is sometimes not understood, or is understood but not accepted, by statisticians from outside the Rasch tradition. To elaborate, statistical tests are based on a priori assumptions about the data. Analysis of variance (ANOVA), For example, assumes a normal distribution, independence of cases, and equal variances of scores across groups. When these assumptions are violated, decisions about whether to accept or reject a null hypothesis may not be trustworthy. Moreover, the output from a statistical test such as ANOVA does not indicate whether its assumptions have been met. It is up to the analyst to carefully examine the data beforehand in order to determine whether they are appropriate for ANOVA. If they are not, a competent analyst will usually seek a more appropriate statistical model, rather than discard data.
Rasch theorists, on the other hand, consider a Rasch analysis to be a distinctly different process from employing a statistical model to test a hypothesis. A Rasch analysis is a procedure for assessing the quality of raw score data and if the data meet certain criteria, for constructing interval-level measures from them. A thorough Rasch analysis involves checking the degree to which the data match a unidimensional measurement model, identifying and diagnosing sources of discrepancy, removing items or persons if they are degrading the overall quality of measurement, and finally, constructing measures which, to the degree that the data approximate the Rasch model, are both interval-level and sample independent. In other words, the "assumptions" of the Rasch model are not evaluated prior to conducting the analysis, but as an integral part of it. Having made that point, it is worth discussing why Rasch theorists regard these properties as requirements of fundamental measurement, and how the requirements are evaluated in a Rasch analysis.

Unidimensionality

The requirement of unidimensionality embodies the common sense notion that it is best to measure one attribute at a time. We would not consider trying to represent the size and the temperature of a room as a single variable, because it is nonsensical. Similarly, while measures of heat, humidity, and wind speed can be combined to form a useful "comfort index," common sense tells us that first constructing separate measures of these components would be less confounding and ultimately more useful. Clear unidimensional variables help us to form conclusions and make decisions free of confounding interpretations.
Some SLA researchers have questioned the application of Rasch measurement to language testing on the grounds that the knowledge and skills underlying foreign language competence are too complex to be conceptualized as a unidimensional construct (e.g. Buck, 1994; Hamp-Lyons, 1989; Nunan, 1989). This objection is unnecessarily restrictive, however, as psychological and psychometric unidimensionality are essentially two different things. Unidimensional measurement does not require that performance on a set of items be due to a single psychological process. In fact, test performance usually incorporates a variety of skills, knowledge, processes, and strategies (Bejar, 1983 p. 31), and individual test takers approach problem solving in unique ways. Unidimensional measurement requires only that the items function in unison to form a single underlying pattern in a data matrix (McNamara, 1996 p. 270-271).

[ p. 23 ]

In Rasch terms, unidimensional measurement means simply that all of the non-random variance found in the data can be accounted for by a single dimension of difficulty and ability. Recall that the Rasch model predicts the likelihood of success at a task based on the gap between a person's ability and the task's difficulty. Improbable responses are predicted to occur, but infrequently and randomly. That is, we should not be able to predict unexpected responses from the responses to other items or by membership in a demographic group. If we can, we infer that there is another psychometric dimension that is influencing responses.
The above definition of unidimensionality is not meant to diminish the importance of having a coherent theory to explain the pattern of responses and communicate their meaning. It is only to clarify that uniformity of psychological processes and strategies is not an a priori requirement for employing Rasch measurement. Critics claiming that language performance is too multifaceted to be suitable for Rasch measurement are imposing an unnecessary restriction based on a different understanding of dimensionality.
Several tools are available for assessing psychometric unidimensionality in Rasch software packages1. Infit and outfit mean square fit statistics provide summaries of the Rasch residuals, responses that differ from what is predicted by the Rasch model, for each item and person. High mean square fit statistics indicate a large number of unexpected responses. This might be due to poor item design – such as ambiguous wording, double keys, etc., or it may be an indication that the item is measuring a different construct. High person mean square values indicate test takers who filled in responses randomly, have unusual gaps in their knowledge, or belong to a demographic group that systematically responds to some items differently.2 Generally, item infit mean square values between 1.5 and 2.0 are considered to be unproductive for measurement, and values higher than 2.0 actually degrading (Wright, Linacre, Gustafson, & Martin-Löf, 1994). The overall quality of a test or questionnaire can often be improved by deleting such items from the analysis. Highly misfitting persons can be permanently deleted from the analysis, measured separately using a subset of items, or temporarily removed while the item difficulties are calibrated and anchored, and then reinstated. If there are a large number of misfitting items or persons, that is an indication that the construct has not been carefully thought out, and it may be necessary to reconsider the rationale that instigated the decision to group the items as a single test.
Another tool for assessing measurement dimensionality is a principal components analysis (PCA) of the Rasch residuals. In this analysis, which can be run directly from Winsteps or RUMM, the primary measurement dimension, difficulty, is first extracted, and the residuals then analyzed for meaningful structure. If the data closely approximate the Rasch model, residual factor loadings will be small, random, and not suggestive of meaningful constructs. In other words, we can confirm psychometric unidimensionality by a failure to find any meaningful components beyond the primary dimension of measurement (Linacre, 2010).
An advantage of residual PCA is that the relative size of secondary dimensions can be assessed. We may, for example, identify extraneous dimensions related to sub-skills or item formats that are large enough to be detected, but not large enough to impact decisions or significantly distort the primary measures. If secondary dimensions are significant enough to impact the empirical meaning or use of the measures, we may consider diagnostic actions such as grouping the items into subtests and constructing additional latent variables (Linacre, 1998).
Yet another technique provided by most Rasch software packages employs graphical charts to indicate person-item interactions, usually referred to as differential item functioning (DIF). DIF can direct attention to items or sets of items that work differently for a demographic group, such as students with a different major or different L1. An illustrative example would be a reading passage related to a popular computer game that is more familiar to boys than girls. The boys can thus utilize their background knowledge to better comprehend the passage and the questions, succeeding more often than their performance on other sections predicts. DIF can also be thought of as a violation of the unidimensionality requirement in that some attitude or realm of knowledge outside of the target domain is impacting performance on an item or subsection for a subset of persons.

Equal item discrimination and error due to guessing

The mathematical expression of the Rasch model implies that all items discriminate equally between high and low ability examinees, and that there is no error due to guessing successfully. These properties draw attention from critics for two reasons. The first reason is that real world test data often do not meet these conditions precisely. If equal discrimination and no guessing are viewed as conventional statistical assumptions that must be verified prior to analysis, they are indeed rather difficult to meet. The second reason is that a similar analytical tool, 2- and 3-parameter item response theory (IRT), eliminates these restrictions by allowing individual discrimination and guessing parameters for each item. Proponents of the IRT approach argue that the relaxed restrictions of the 2- and 3-parameter models make them more appropriate for real world test data.

[ p. 24 ]

To address the former point first, the Rasch model is an ideal. It is a standard intended to describe the response pattern that would be observed if all items were measuring the same construct, were independent of each other, and had no non-random measurement error. Real world data are not expected to match the model perfectly. A Rasch analysis seeks to determine whether the data approximate the model closely enough to be useful. The analysis produces various graphs and indices that allow us to quantify the degree of deviance from the model, identify sources of measurement disturbance and correct them, and then make informed decisions about whether the data are "good enough" to meet our purposes. The primary motivations of a Rasch analysis are evaluation, diagnosis, and fine-tuning. Generally, research and experience have shown that measures constructed from Rasch models are robust to minor deviations from the model's requirements (Henning, Hudson, & Turner, 1985; Smith, 1990).
Regarding the latter point, if differences in item discrimination and susceptibility to guessing are systematic properties of test items, it would seem quite sensible to utilize those properties to produce better estimates of person ability, the approach taken in 2- and 3-parameter IRT. To understand why Rasch theorists reject individualized discrimination and guessing parameters, first note that a Rasch analysis estimates a single, averaged discrimination parameter that is applied to all items in the instrument. Items with observed discrimination values significantly higher or lower than this uniform value are then scrutinized, on the assumption that below average values indicate a weak relationship to the primary construct, and above average values imply a lack of item independence. The degree of deviation is summarized in the Rasch mean-square fit statistics. In fact, Rasch mean square fit statistics, the point-biserial correlations used for item discrimination in classical test theory, and the discrimination slope values used in IRT are highly correlated and provide essentially the same information (see Hudson, 1991; Reynolds, Perkins, & Brutten, 1994).
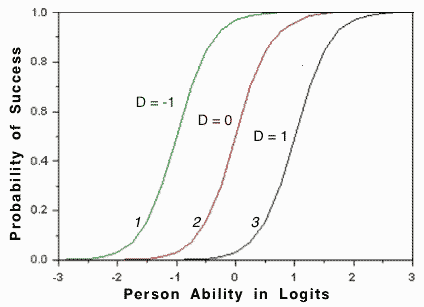
Item characteristic curves (ICC), shown below in Figures 1 and 2, are useful in illustrating the logic underlying the Rasch point of view. In Figure 1, three ICCs indicate the probability that a person of ability B, delineated along the x-axis, will answer an item successfully. An item's difficulty, D, is the point midway along the curve where the probability of success is 0.5. The difficulty calibrations of Items 1, 2, and 3 are thus minus one, zero, and one logit, respectively. The slope of the curves, usually labeled a, corresponds to the discriminability of the item. It indicates how well an item differentiates between examinees having abilities above the item's difficulty location from those having an ability below, a steeper slope indicating high discriminability.3
Figure 1
Figure 1. Hypothetical Rasch item characteristic curves.


Figure 1 illustrates how three hypothetical ICCs might be rendered by a Rasch software package. We can estimate the probability of success of an examinee of any ability on each item by drawing a perpendicular through a point on the x-axis and noting where the line intersects the ICC. For example, a person with zero logits of ability would have about a 98 percent probability of answering Item 1 correctly, a 50 percent probability of answering Item 2 correctly, and a 2 percent probability of answering Item 3 correctly. Most importantly, all three items have equal slopes (discrimination), and at no point do the ICCs cross each other. The relative difficulty of each item is unambiguous for any point along the ability continuum.

[ p. 25 ]

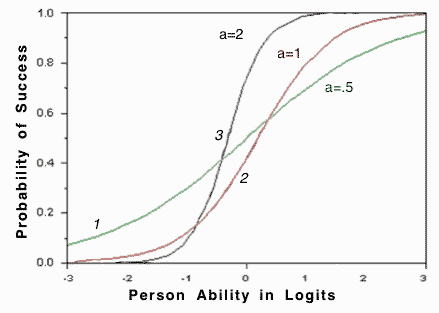
In Figure 2, however, each item has been rendered with an individualized slope, the procedure followed when using a 2-parameter IRT model. This allows the ICCs to cross each other at various points along the ability continuum. Now, the rather straightforward question of "which item is easiest" becomes ambiguous. For persons with abilities in the region of minus one logit, Item 1 is the easiest, with a probability of success of about .30, followed by Item 2 and then Item 3. At zero logits of ability, however, Item 3 is the easiest, followed by Item 1 and then Item 2. Finally, for a person with an ability of one logit, the order of difficulty is reversed: Item 3 is easiest, followed by Item 2, followed by Item 1. This ambiguous ordering of item difficulty destroys the Rasch concept of construct validity, which relies on the implicative hierarchy of task difficulty to define the latent variable. For a detailed discussion of the implications of allowing crossed ICCs on construct validity, including an intriguing example, see Wright (1992, 1999).
Figure 2
Figure 2. Crossed item characteristic curves characteristic of a 2-parameter IRT model.

Discrimination, unidimensionality, and item independence

The implications for construct validity of crossed ICCs is not the only objection to allowing individual discrimination calibrations for each item. As mentioned previously, item discrimination is related to the fundamental measurement requirements of unidimensionality and item independence. An item with no correlation whatsoever with the other items in the test would have a flat ICC. Gentle ICC slopes, like low point biserial correlations, imply a weak relationship to the other items: overall ability on the latent variable has little effect on the likelihood of answering the item correctly. Such items are either adding random noise due to design flaws, or they are measuring a different construct. IRT approaches deal with such items by according them less weight in the estimation of ability. Rasch methodology, with its stronger emphasis on diagnosis, prefers to identify weak items through fit statistics and if their contribution to the construction of the measure is insubstantial, delete them.
"Items that predict the total score more than other items are likely to be redundant, or in some way dependent on other items. "

But what is the problem with highly discriminating items? High discrimination is considered an asset in classical norm-referenced testing and 2-parameter IRT, an indication that an item is a superior indicator of the latent variable. In Rasch theory, it is not that highly discriminating items are undesirable per se. Rather, the question is why would an item have a significantly higher than average correlation to the total score? Items that predict the total score more than other items are likely to be redundant, or in some way dependent on other items. There are many sources of item dependency, but an illustrative example is to imagine that in a long test, an item is inadvertently used twice (I've known this to actually happen). Assuming that test takers answer the item consistently, able examinees get two points for answering correctly while weaker ones lose two points. This will boost both items' correlation with the total score while providing no unique information about examinee ability. There would be, literally in this case, a "two for one" effect. Besides this unlikely but illustrative example, there are other, more subtle sources of item dependence or redundancy:
  1. Stems or distractors that provide clues to other items. However the clues require a certain level of ability before they are noticed and utilized, so only able examinees benefit.

  2. Success creates additional context. Cloze tests may have this problem. As items are filled in, context increases, providing additional clues to the more able test takers.

[ p. 26 ]

  1. A matching format with an equal number of stems and choices. Those who know k-1 items are certain to know k items. They get the last item, presumably the hardest, for free.

  2. Easy items that appear near the end of a long test. High ability examinees answer successfully because the items are easy. Low ability examinees probably could answer successfully, but do not have time to attempt them.

  3. A questionnaire item is merely a negative restatement of another item, reverse scored. For example, "I love to study English" and "I hate to study English."

  4. A questionnaire item is a "summary item." Summary items summarize a set of other items, or even name the construct. For example, "Overall, I am highly motivated to learn English." Respondents who have responded positively to other motivation questions are obliged or compelled to agree.
Items such as the above tend to overfit the Rasch model. They produce low mean square fit statistics, and if ICCs are drawn, have steeper slopes. They do not add noise or degrade the quality of measurement as poorly discriminating items do, and it is not absolutely necessary to delete them from an analysis. The chief harm done by overfitting items is that they create artificial variance, by "robbing the poor to feed the rich," so to speak. This leads to inflated estimates of reliability, fooling us into believing that we are measuring more accurately than we actually are. From the perspective of Rasch theory, the IRT procedure of according highly discriminating items a greater weight when estimating ability exacerbates this problem.

Success Due to Guessing

In the 3-parameter IRT model, the lower asymptote, the tail of the ICC where the probability of success approaches zero, can be set to approach a value other than zero, such as 20 percent. The rationale is that in an item format such as five-option multiple choice, an examinee making random choices would have a twenty percent probability of answering an item correctly, so the probability of answering correctly is never zero. Moreover, this value can be individually estimated for each item, an acknowledgement that difficult items or items with implausible distractors are more susceptible to guessing error. As the 2-parameter IRT model does with discrimination, the 3-parameter IRT employs a weighting scheme to progressively correct for guessing. Correct responses to items whose difficulty is considerably higher than an examinee's ability are accorded a reduced weight, proportionate to their improbability, when used to estimate ability.
". . . most examinees do not engage in random guessing. Guessing behavior appears to be an individual attribute, related to risk-taking, cultural background, and test-wiseness . . ."

Like individualized slopes, individualized asymptotes lead to crossed ICCs and are objected to in Rasch methodology for the same reasons. Rasch methodology does, however, permit an analyst to specify a lower asymptote higher than zero, so long as it applies to all items, preserving the uniformity of the test-wide ICC. Unlike IRT, however, a Rasch guessing threshold does not reduce the scoring weight of improbable successes. Rather, when the gap between an item and a person is above a designated threshold, such as 2 logits, the response is automatically treated as missing data. Such a strategy might be applied post hoc, for example, if insufficient time for a test administration led to a large number of random answers near the end of the test.4
Studies of guessing behavior, however, have found that most examinees do not engage in random guessing. Guessing behavior appears to be an individual attribute, related to risk-taking, cultural background, and test-wiseness (Gershon, 1992; Waller, 1973). This can be a problem when a 3-parameter model is applied, as it penalizes examinees who simply leave blanks for items they cannot answer. In principle, a well-designed multiple-choice test should have little error due to guessing if items are well-targeted, adequate time is provided, and distractors are effectively designed. Rather than treating guessability as an item property, Rasch methodology stresses minimizing guessing error by designing distractors to attract different ability levels, setting appropriate time limits, creating linked, alternate test forms if there is a wide range of ability, and by applying the Rasch partial credit model to exploit information to be found in distractor choice (see part 3 of this series, Sick, 2009a).
The evaluative and diagnostic approach taken in Rasch methodology views guessing error as a flaw in item or test design. Guessing is not distinguished from any other kind of error. That is, its impact is quantified and evaluated through fit statistics, and if severe enough to warrant, remedied. Because this source of error is peculiar to "choice#formats, test designers may need to decide whether the convenience of machine scoring justifies the additional error, in light of how the measures will be used. A test designer might, for example, decide that the multiple-choice format is too error prone for high stakes decisions such as medical licensure, but suitable for less crucial applications such as educational placement. Evaluation of fit helps to identify and quantify error, leading to more informed decisions.

Deleting data

[ p. 27 ]

"When a test or questionnaire has been carefully designed, data deletion amounts to fine tuning: a few items or persons that did not function as expected are removed in order to make the constructed measures more efficient, reliable, and inferentially valid."

The Rasch practice of deleting items or people from the analysis when they do not conform to the Rasch model strikes some researchers as wasteful, or even manipulative. However, individual items are intended to productively contribute to a sound inference of an examinee's ability, just as individual examinees are expected to contribute to a meaningful ranking of the items. Deleting persons who are uncooperative, or items that are error-prone or measuring a different construct, is little different from ignoring the advice of fools and liars. When a test or questionnaire has been carefully designed, data deletion amounts to fine tuning: a few items or persons that did not function as expected are removed in order to make the constructed measures more efficient, reliable, and inferentially valid. When an analysis finds that a large number of persons or items are misfitting, it is an indication of greater problems. Perhaps the construct has yet to be conceptually well defined, or there is significant failure of instrument design, targeting, or administration. In other words, there has been a failure to achieve sound measurement. In such cases, it is dubious practice to employ summed scores in any form to indicate degrees of difference on a single variable.

Notes
  1. See (Sick, 2009b) for a review of various Rasch software packages.
  2. A complete discussion of how to diagnosis misfitting items is beyond the scope of this article, but interested readers are directed to the section entitled "Misfit diagnosis: infit outfit mean-square standardized#in the latest edition of the Winsteps manual, available for free download from www.winsteps.com.
  3. In classical test theory, item discrimination is generally reported as the point biserial correlation of an item with the total test score, or as the item facility of the top third scorers minus the item facility of the lower third. If it is not clear to you why a steeper ICC slope corresponds to greater item discrimination, think of the probability of success on the y-axis as the percentage of test takers who would answer correctly, given a large enough sample. Looking at Figure 2, compare the difference in expected success rates between two ability points for each ICC. For example, subtract the expected success rate of examinees at minus one logits from the expected rate for examinees at zero logits. You will see that Item 1, which has the gentlest slope, has a difference of about 20 percent, while Item 3, the item with the steepest slope, has a difference of about 60 percent. This is quite similar to the top third/bottom third approach used in classical test theory, but can be applied anywhere along the ability continuum.
  4. Not all Rasch software packages offer this feature. In Winsteps, a Rasch equivalent of a lower asymptote can be set for all items using the "cutlo#function. The cutlo function automatically treats responses as missing data if the gap between person and item is above a designated threshold.

References

References Bejar, I. I. (1983). Achievement testing: Recent advances. London: Sage Publications.

Buck, G. (1994). The appropriacy of psychometric measurement models for testing second language listening comprehension. Language Testing, 11 (2), 145-170. DOI: 10.1177/026553229401100204

Gambrell, J. L. (2010, June 14). Rasch modelling to identify a one-dimensional construct [Message 2]. SEMNET: Structural Equation Modeling Discussion Group. Retrieved October 1, 2010 from http://alabamamaps.ua.edu/archives/semnet.html

Gershon, R. (1992). Guessing and Measurement. Rasch Measurement Transactions, 6 (2), 209-210. Retrieved from http://www.rasch.org/rmt/rmt62a.htm

Hamp-Lyons, L. (1989). Applying the partial credit method of Rasch analysis: language testing and accountability. Language Testing, 6 (1), 109-118. DOI: 10.1177/026553228900600109

Henning, G., Hudson, T., & Turner, J. (1985). Item response theory and the assumption of unidimensionality for language tests. Langauge Testing, 2 (2), 141-154. DOI: 10.1177/026553228500200203

Hudson, T. (1991). Relationships among IRT item discrimination and item fit indices in criterion-referenced language testing. Language Testing, 8 (2), 160-181. DOI: 10.1177/026553229100800205

Linacre, J. M. (1998). Structure in Rasch residuals: Why principal components analysis? Rasch Measurement Transactions, 12 (2), 636. Retrieved from http://www.rasch.org/rmt/rmt122m.htm

Linacre, J. M. (2010). A users guide to Winsteps Rasch model computer program: Program manual 3.70. Chicago: Winsteps.

[ p. 28 ]

McNamara, T. F. (1996). Measuring second language performance. New York: Longman.

Nunan, D. (1989). Item response theory and second language proficiency assessment. Prospect, 4 (3), 81-93.

Reynolds, T., Perkins, K., & Brutten, S. (1994). A comparative item analysis study of a language testing instrument. Language Testing, 11 (1), 1-13.

Sick, J. R. (2009a). Rasch measurement in language education Part 3: The family of Rasch models. SHIKEN 13 (1), 4-10. Retrieved October 1, 2010 from http://jalt.org/test/sic_3.htm

Sick, J. R. (2009b). Rasch measurement in language education Part 4: Rasch analysis software programs. SHIKEN, 13 (3), 13-16. Retrieved October 1, 2010 from http://jalt.org/test/sic_4.htm

Smith, R. M. (1990). Theory and practice of fit. Rasch Measurement Transactions, 3 (4). Retrieved October 1, 2010 from http://rasch.org/rmt/rmt34b.htm

Waller, M. I. (1973). Removing the effects of random guessing from latent ability estimates. Unpublished Ph.D. Dissertation, University of Chicago.

Wright, B. D. (1992). IRT in the 1990s: Which models work best? Rasch Measurement Transaction, 6 (1), 196-200. Retrieved October 1, 2010 from http://www.rasch.org/rmt/rmt61a.htm

Wright, B. D. (1999). Fundamental measurement for psychology. In S. E. Embretson & S. L. Hershberger (Eds.), The New Rules of Measurement. Mahwah, NJ: Lawrence Erlbaum.

Wright, B. D., Linacre, J. M., Gustafson, J. E., & Martin-Löf, P. (1994). Reasonable mean-square fit values. Rasch Measurement Transactions, 8 (3), 370. Retrieved October 1, 2010 from http://www.rasch.org/rmt/rmt83b.htm


NEWSLETTER: Topic IndexAuthor IndexTitle IndexDate Index
TEVAL SIG: Main Page Background Links Network Join
last Main Page next
HTML: http://jalt.org/test/sic_5.htm   /   PDF: http://jalt.org/test/PDF/Sick5.pdf

Rasch Measurement in Language Education Series:
Article 1: Article 2: Article 3: Article 4: Article 5: Article 6:
HTML HTML HTML HTML HTML HTML
PDF PDF PDF PDF PDF PDF

[ p. 29 ]