Shiken: JALT Testing & Evaluation SIG Newsletter
Vol. 12 No. 1. Jan. 2008. (Supplement) [ISSN 1881-5537]
PDF PDF Version

Suggested Answers for Assessment Literacy Self-Study Quiz #4
by Tim Newfields

Possible answers for the nine questions about testing/assessment which
were in the January 2008  issue of this newsletter appear below. If you feel an answer is unclear or disagree with a conclusion, please contact the editor.

Part I: Open Questions

1 Q: What is the test item below likely measuring? What would be the arguments for and against including this item on an EFL test for aspiring university students?

INSTRUCTIONS (translated from Japanese): Read the sentence below, then select
one sentence (A-D) in which the term "that" is used in the same manner as in the original sentence:


Sentence:
If there is something that you want to see, let me know.

Possible Answers:
     	(A) The shoes that I bought did not fit.
     	(B) She hid the fact that she spoke French.
     	(C) I'm so glad that he could come.
     	(D) Such was her anger that her face turned red.

   A: This invites a deeper question: how do we know what a test item is measuring? To answer that question scientifically involves a lot more work than most of those writing amateur entrance exams are willing to go through. The teacher who created this test item probably thought it was measuring grammatical knowledge. Specifically, the item was probably designed to test the ability to discriminate between relative clauses (kankei dai-meishi) and conjunction clauses (kansetsu meishi).
* What would be a reason for including such an item in a test? If you believe that understanding formal grammar is important for English mastery, an argument for inclusion could be made. In fact, a generation ago when grammar-translation theory held ascendancy items like this were common in university entrance exams in Japan.
* What are the main arguments against using an item like this? Those coming from a communicative language teaching/testing perspective would probably regard formal linguistic knowledge, particularly about arcane points as this, as unnecessary. Rather than focus on tasks requiring an explicit declarative knowledge of grammar as in this task, tasks requiring applicants to use words such as "that" to express broader ideas appropriately would probably be emphasized.

Further reading:

Fowler, H. W. (1908). The King's English, 2nd ed. Oxford: Clarendon Press. Online Edition retrieved January 12, 2008 from http://www.bartleby.com/116/209.html


2 Q: Mention at least three problems with the Oct. 9, 2006 Washington Post article claiming "71% [of the students surveyed] felt the number of tests they have to take is 'about right'" and that "79% thought standardized test questions are fair."

   A: This is a good example of sloppy - and also arguably unethical - statistical reporting. To responsibly report research information such as this, the following information should be included:
  1. Details about the sample size and precisely who the respondents were and how they were selected.
  2. The precise wording of the survey questions and exact response format.
  3. Information about how many people did not complete the survey or how many responses were discounted due to response errors.
  4. The measurement error for the reported statistic.
  5. A reference to the original study so that persons seeking more detailed information could corroborate the information.
  6. A brief note about the limitations of the study involved and some note about the generalizability of this specific study to other contexts.

Further reading:

Nelson, L. A. & Crotty, M. (2007, March 6). The ethical use of statistics in research. Retrieved January 12, 2008 from http://www.chass.ncsu.edu/langure/modules/ documents/Ethicaluseofstatisticsdraft1.doc


3 Q: Offer an example of a (1) positive directional hypothesis, (2) negative directional hypothesis, and (3) a non-directional hypothesis from the field of foreign language study.

   A: Asserting that English proficiency tends to improve with length of study is a positive directional hypothesis. The conjecture that that the longer adolescent Japanese reside in the USA, the less proficient their kanji writing ability tends to become is a negative directional hypothesis. Asserting that test anxiety has some correlation with test performance (possibly beneficial in slight amounts but negative if too extreme) is an example of a non-directional hypothesis. Why is it important to know the direction of a hypothesis? One reason is the decision whether to use a one-tailed or two-tailed t-test depends primarily on the hypothesis being tested.

Further reading:

Stockburger, D. W. (n.d.). Introductory statistics: Concepts, models, and applications: One and two-tailed t-tests. Retrieved January 14, 2008 from http://www.psychstat.missouristate.edu/introbook/sbk25m.htm


4 Q: What problems are there with using a word-matching test of vocabulary using two different languages as in the example below?
Sample J/E Vocab. Test Item

   A: It all depends on the types of claims that are made about this test. If we claim that this sort of test is merely a measure of the ability to read Japanese word definitions and then match them with similar English cognates, there is no problem in terms of this test's content validity. However, if we wish to claim that this is a measure of "English vocabulary" then there are vexing issues which must be grappled with. For example, this test likely favors those who are proficient at reading Chinese characters. As Kataoka, Koshiyama, & Shibata, (2008, p. 63) suggest, many Japanese who have lived overseas a long time are not so adept at reading kanji. Also, this test suggests an equivalence of English and Japanese words. As Griffe (1998, p. 16) points out, some concepts do not translate well between Japanese and English. Finally, the ability to guess the correct word in a multiple choice context does not necessarily mean that a person can use that word in real life situations. As Nunn (2001) alludes the extent that fixed- response test tasks generalize into real-world performance is open to question.

Further reading:

Griffee, D. (1998) Can we validly translate questionnaire items from English to Japanese? Shiken: JALT Testing & Evaluation SIG Newsletter, 2 (2) 15 - 17. Retrieved January 14, 2008 from http://jalt.org/test/gri_1.htm

Kataoka, H. C., Koshiyama, Y. & Shibata, S. (2008), Japanese and English ability of students at supplementary schools in the United States. In K. Kondo-Brown & J. D. Brown (Eds.) Teaching Chinese, Japanese, and Korean heritage students: Curriculum needs, materials, and assessment. ESL & Applied Linguistics Professional Series. (pp. 47 - 76). New York & Abingdon, U.K.: Lawrence Erlbaum Associates

Nunn, B. (2001). Task-based methodology and sociocultural theory. The Language Teacher, 25 (8). Retrieved January 13, 2008 from http://www.jalt-publications.org/tlt/articles/2001/08/nunn


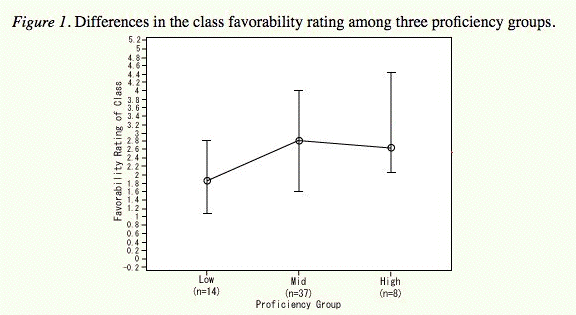
5 Q:(1) First, this graph has one major mistake needing rectification. Can you recognise it? (2) Also look at this graph and suggest any ways to made the information clearer. (3) Without reading the article, briefly interpret the graph. What can be surmised about the distribution of the sub-groups? (4) Finally, suggest a viable alternative way of comparing the high, mid, and low sub-groups.
Hamada, Oda, and Kito's Figure 1


   A: (1) Since standard deviations are by definition equidistant from the mean, something is wrong with the anchor bar for the high sub-group.

(2) Since this is a 1-5 Likert scale rating, the highest possible score is 5.0 and the lowest possible score is 1.0. Having parameters beyond those values is meaningless. The parameters should be set from 1-5 rather than -0.2 to 5.2. To get a more vivid view of how the data is distributed, a 3-color scattergraph (or even a box plot) might be superior to this line graph with anchor bars. Each response would appear as a small "o" and each sub-group would have a different color. Another option would be to use a standard box plot (depicting the lowest rating, lower quartile, median, upper quartile, and highest rating).

(3) Figure 1 suggests the following about each sub-group: (4) Instead of having sub-groups of 14, 37, and 8 participants respectively, it would be better to place the top 27% in the "high" sub-group, the bottom 27% in the "low" sub-group, and the remaining 46% in the "mid" sub-group (Mousavi, 2002, p. 362). With 16 persons in the upper and lower sub-groups and 27 in the mid sub-groups, we are in a better position to examine the relation between test scores and class attitudes. Still, any attempt to divide 59 students into three sub-groups raises questions about the statistical power of this test: a larger sample size is needed to increase the power of this test.
* Another way to approach this whole issue would be through IRT modeling. Since IRT treats sample size as a probabilistically irrelevant factor, this option has appeal. Refer to Janssen, Tuerlinckx, Meulders, and De Boeck (2000, 285-306) for one way to analyze a criterion-referenced test through IRT.

Further reading:

Box plot. (2008, January 11). In Wikipedia, The free encyclopedia. Retrieved January 14, 2008 from http://en.wikipedia.org/wiki/Box_plot

Brown, J. D. (1997). Skewness and kurtosis. Shiken: JALT Testing & Evaluation SIG Newsletter, 1 (1) 18 - 20. Retrieved January 14, 2008 from http://jalt.org/test/bro_1.htm

Janssen, R.; Tuerlinckx, F.; Meulders, M.; & De Boeck, P. (2000). A hierarchical IRT model for criterion-referenced measurement. Journal of Educational and Behavioral Statistics, 25 (3) 285-306.

Mousavi, S. A. (2002). An Encyclopedic Dictionary of Language Testing, (3rd Ed.). Taipei: Tung Hua Book Company. p. 362.

[ p. 19b ]

Part II: Multiple Choice Questions


1 Q: A t-distribution is generally resembles a normal Z-distribution except


   A: The correct answer is (a). Whereas a Z-distribution is the theoretical distribution of a population, a t-distribution is the distribution of a sample. As the degrees of freedom increase, t-distributions approach z-distributions. A simple way to conceive of the concept of degrees of freedom is the number of opportunities for change within a constrained system. As the number of observations or samples from a population increase, the number of degrees of freedom tend to rise. A more precise discussion of this concept is offered by Stone and Ellis (2006).
* The inverse is true for statements (b) - (d). A t distribution with only a few degrees of freedom is likely to have a more outlying data than a normal bell curve. By definition, a tdistribution is less accurate that the population it represents. Finally, as the degrees of freedom in a sample increase, the differences between t and Z- distributions become less and less noticeable.

Further reading:

Simon, L. J. (1999). Penn State Department of Statistics: Statistical Education Resource Kit: Confidence Interval for a Mean: PPT Slide. Retrieved January 16, 2008 from http://www.stat.psu.edu/~resources/ClassNotes/ljs_19/ljs_19.PPT -

Stone, D. C. & Ellis, J. (2006). Stats Tutorial - Degrees of Freedom. Retrieved January 16, 2008 from http://www.chem.utoronto.ca/coursenotes/analsci/StatsTutorial/DegFree.html

Virginia Tech. (1997, 1999). The t-Distribution and its use in hypothesis testing. Retrieved January 16, 2008 from http://simon.cs.vt.edu/SoSci/converted/T-Dist/


2 Q: Which of the following is generally not considered a test method facet?


   A: A test facet is a construct-irrelevant aspect of a testing procedure which may impact the performance on that test (Jafarour, 2003, pp. 57-87). From this point of view, the validation procedure is usually not considered a "test facet". However, if we take a long-range view of time and reflect on why some test artifacts persist and some tests become fossil relics, then it would be possible to argue that even the test validation procedure (or lack thereof) is a sort test facet.

Further reading:

Jafarpur, A. (2003). Is the test constructor a facet? Language Testing, 20 (1) 57-87.


3 Q: Quasi-experimental research designs (i.e. studies in which the subjects are not randomized into different experimental and control groups) are also often known as

   A: In quasi-experimental research, participants are not randomly grouped; the treatment group and control group are based on convenience samples. In non-experimental designs (often used in case studies or ethnography) there is no control group. An incomplete factorial design is one type of experimental design that use randomized samples in which not all sub-groups investigated because the research focus is just on some sub-groups. Hence our only remaining choice is (a). According to Garson (1998, 2007) quasi- experimental designs are also known as correlational designs.

Further reading:

Garson, G. D. (1998, 2007). PA 765: Research designs. Retrieved January 14, 2008 from http://www2.chass.ncsu.edu/garson/pA765/design.htm


4 Q: In statistics, the symbol tc sometimes refers to

   A: Well, according to the Veenhoven and Kalmijn (2002) the correct answer is (c). That statistic is a way of comparing the strength of the cross tabulations of two ordinal variables. Rightly or wrongly, Veenhoven and Kalmijn also claim it can be used for cross tabulations between one ordinal variable and a non-ordinal variable. The closer Kendall's tau-c becomes to zero, the weaker the degree of association between two sets of tabulations are. A Kendall tau-c of -1 would imply a perfect negative association and +1 a completely positive correlation. This statistic is closely related to several other formulas by Kendall and discussed in more detail by Lohning (2006) and Garson (2007).
* The t-critical value represents the cutoff between accepting or rejecting the null hypothesis. If a t-statistic is farther from 0 than the t-critical value, the null hypothesis should be rejected. This statistic is important in terms of hypothesis testing.
* T-confidence is the confidence interval for a t-test and t-closure is a concept describing topological space.

Further reading:

Central Virginia Governor's School for Science and Technology. (2003). T-test Distribution. Retrieved January 15, 2008 from http://www.cvgs.k12.va.us/DIGSTATS/main/inferant/d_tdist.htm

Garson, G. D. (2007, December 14). Ordinal Association: Gamma, Kendall's tau-b and tau-c, Somers' d. Retrieved January 15, 2008 from http://www2.chass.ncsu.edu/garson/pA765/assocordinal.htm

Kendall tau rank correlation coefficient. (2007, October 27). In Wikipedia, the free encyclopedia. Retrieved January 14, 2008 from http://en.wikipedia.org/wiki/Kendall%27s_tau

Lohning, H. (2006, March 27). Ordinal Association. Retrieved January 15, 2008 from http://www.statistics4u.info/fundstat_eng/ee_kendall_rank_correlation.html

Veenhoven, R. & Kalmijn, W. (2002). World Database of Happiness: Correlational Findings: Correlates of Happiness: Chapter 4. Retrieved January 14, 2008 from http://worlddatabaseofhappiness.eur.nl/hap_cor/introtexts/introcor-contents.htm


NEWSLETTER: Topic IndexAuthor IndexTitle IndexDate Index
TEVAL SIG: Main Page Background Links Network Join
last Main Page next
HTML: http://jalt.org/test/SSA4.htm   /   PDF: http://jalt.org/test/PDF/SSA4.pdf
ASSESSMENT LITERACY ONLINE SELF-STUDY QUIZES:

Quiz 1: Qs   / As    *    2: Qs   / As    *    3: Qs   / As    *    4: Qs   / As    5: Qs   / As   *    6: Qs   / As   *    7: Qs   / As    8: Qs   / As   9: Qs   / As   10: Qs   / As  

[ p. 20b ]