Shiken: JALT Testing & Evaluation SIG Newsletter
Vol. 13 No. 3. November 2009 (p. 29 - 38) [ISSN 1881-5537]
PDF PDF Version

Suggested Answers for Assessment Literacy Self-Study Quiz #8
by Tim Newfields

Possible answers for the nine questions about testing/assessment which were in the November 2009 issue of this newsletter appear below.

Part I: Open Questions

1 Q: (1) What confounding issues are present in the study by Higginbotham (2009, pp. 15-18)? How could the validity and reliability of studies like this be enhanced? Also, how should the graph at http://jalt.org/test/Graphics/SSQ8a.png appear in an academic publication?

   A: There are at least 6 confounding issues present in Higginbotham's study.
* First, it is unwise to speculate on attitudes towards a given teaching approach on the basis of the performance a single activity based on that approach. In the activity cited, students who dislike singing might respond negatively to this particular activity, but positively to other activities rooted in the same teaching approach. To get a better idea about the effectiveness of a teaching approach, a range of activities consistent with that approach should be investigated.
* Second, a strong expectancy bias is apparent in the wording of the survey statements. Efforts should be made to keep researcher expectations opaque (Maxwell, 1996, 66-78). Statements such as "I enjoyed the carol singing event" tend to inflate ratings since it's "safer" for students not to disagree with their teacher-researcher's opinions. This is particularly the case in small classes where student-respondents are not fully anonymous. A better wording of this question would have been, "How did you feel about the carol singing event?" This would likely yield more accurate responses since less researcher expectancy is evident (Branch, 2006).
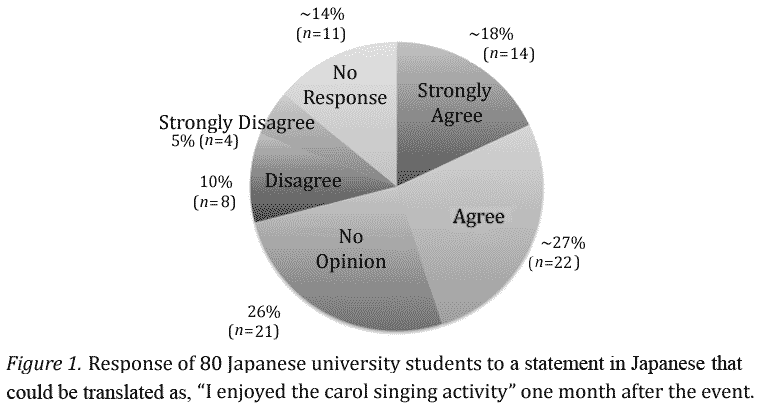
* Third, nearly 14% of the respondents did not complete this survey. A "no response" category should have been included in this graph. The original Figure 1 either neglects to mention 11 of the 80 students who didn't do the survey – or else blends their responses into the "no opinion" category. A "no response" is not the same as "no opinion".
* Fourth, the language of a survey may influence its responses as Griffee (1998, pp. 11 - 14) points out. In Higginbotham's research it was not clear what language the respondents used to answer the survey questions. Japanese terms such as "itsumo" itsumo and "sukoshi omou" sukoshi-omou", which are common in surveys, do not cover the same lexical range as their English cognates. Hence, when describing survey results it's important to specify which language was used to obtain data.
* Fifth, gender, ethnicity, and academic majors are potentially significant variables not mentioned in this study. The author neglects to indicate the ratio of males to females, Japanese to non-Japanese, or English majors to other majors. It is quite possible, for example, that females might respond differently to carol singing activities than males. Also, study abroad students from China and Korea might exhibit a different response pattern from their Japanese peers. Moreover, English and non-English majors might regard activities like this in a different light. The influence of each of these standard demographic variables needs to be explored before any conclusions about the teaching approach can be made.

[ p. 29 ]

Sixth, religion is possibly a confounding factor in this study. Though many university students in Japan are only marginally aware that Christmas is a Christian holiday, at least a some non-Christians might feel ambivalent about celebrating the birth of Christ through song.
* Finally, since the survey sample size is somewhat small and other confounding issues might be present, this study's reliability would be enhanced by extending the time frame and researching this activity over a two-year period rather than in a single year. If the same activity were repeated with a different cohort group (technically known as a "panel"), then a more accurate picture of how the students felt could probably be obtained.
* The so-called "vocabulary test" mentioned by Higginbotham will need more than 5 items to be reliable. I would recommend including at least 25 items in the vocabulary test, then applying the Spearman-Brown Prophecy formula to see how many more items would be needed to obtain an acceptable reliability coefficient.
* A more appropriate way to present the survey results that originally appeared in The Language Teacher is offered below.

Revised Figure 1 for the study by Higginbotham

* Note that this title is more precise – it indicates the timing of the survey, the language of the survey, as well as the sample size. Also, the "no response" data is duly included. Finally, the raw numbers are indicated in addition to percentage figures.

Further reading:

Branch, W. A. (2006). Sticky information and model uncertainty in survey data on inflation expectations. Journal of Economic Dynamics and Control, 31 (1) 245-276. doi:10.1016/j.jedc.2005.11.002

Griffee, D. (1998). Can we validly translate questionnaire items from English to Japanese? Shiken: JALT Testing & Evaluation SIG Newsletter, 2 (2) 11-14. Retrieved December 3, 2009 from http://jalt.org/test/PDF/Griffee1.pdf

Maxwell, J. A. (1996). Qualitative Research Design: An Interactive Approach. Thousand Oaks, CA: Sage.

3 Q: What specific test validity issues are compromised through the recommendation system Suisen Nyuushi used by many Japanese universities? What viable alternatives to the existing suisen nyuushi system exist?

[ p. 30 ]

   A: Let's first consider some issues about the essay exams, then the interviews.
* At schools where recommended applicants submit essays that have been prepared in advance, the question of authorship arises. Wealthy applicants can pay for cram school instructors to tailor their essays to the schools they are applying for. Applicants with more limited financial resources will have to rely on less expert advice from parents or ordinary teachers. Obviously, this raises questions about test fairness.
* Even if essays are written in quasi-testroom settings, applicants often have a good idea of what the exam topic(s) will be since schools tend to vary little from year to year (Tamamoto, 2009, par. 17-19). Cram school teachers are often adept at analyzing what essay topics will appear in a given year and informing students how the grading system works.
* The essay grading system itself seems to vary widely from school to school, and alas even from teacher to teacher. At schools with huge applicant numbers, time pressures on teachers make effective rating difficult. In a typical scenario, make-shift rubrics are used by one or two teachers to assign points to essays based on rough impressions based on a quick document scan. Instead of using a blind rating system, it's not uncommon for teachers to confer with each other while assigning scores. In such situations, the teacher with less status generally to yields to the teacher with more status should any disagreement arise.
* Regarding oral interviews, a typical scenario is one in which two teachers chat with each applicant for 5-10 minutes to obtain a holistic impression. The interview questions are largely pre-determined, and most students have rehearsed what to say. Extroverted and relaxed applicants have a tendency to score higher in such interviews than ones who are shy or nervous (Berry, 1994). It is also quite possible that applicants who are well-dressed or with appropriate body language obtain higher scores (Nakatsuhara, 2008; Ilkka, 1995). For these reasons, such oral interviews are at best very rough measures of how relaxed and outgoing students appear to be at the time of the interview. Confounding factors that may influence subjective evaluation techniques should either be controlled for or taken in account when attempting to measure academic ability or "psychological fitness" for university.
* Alternatives to the current recommendation system are plentiful. At least some alternative admission schemes recommend giving more weight to high school grade point averages. Another element at some schools is to include norm-referenced tests such as the TOEFL or the TOEIC. Applicants to Sophia University's Liberal Arts Faculty, for example, must have 4.0+ high school GPAs and have an unspecified TOEFL score (Jouchi Daigaku, 2009).
* In lieu of standard entrance exam interviews, Murphey (2009, pp. 20-21) has suggested that students read short, authentic English passages from overseas publications for 10-15 minutes, then discuss the articles in small groups while teachers evaluate the fluency, accuracy, strategic competence, and interactive competence of the applicants.
* Brown (2002) also lists many suggestions to improve the university entrance exam process. Despite the likely merits of these reform proposals, the current recommendation exam system remains an entrenched at most universities in Asia.

Further reading:

Berry, V. (1993). The assessment of spoken language under varying interactional conditions. In E. Norman et al Language & Learning: Papers Presented at the Annual International Language in Education Conference. Hong Kong. ERIC Document #ED386065.

[ p. 31 ]

Brown, J. D. (2002) English language entrance examinations: A progress report. In A. S. Mackenzie & T. Newfields (Eds). Curriculum Innovation, Testing and Evaluation: Proceedings of the 1st Annual JALT Pan-SIG Conference. May 11-12, 2002. Kyoto, Japan: Kyoto Institute of Technology. Retrieved November 24, 2009 from http://jalt.org/pansig/2002/HTML/Brown.htm
Ilkka, R. J. (1995). Applicant appearance and selection decision making: Revitalizing employment interview education. Business Communication Quarterly, 58 (3) 11-18. doi: 10.1177/108056999505800303

Jouchi Daigaku Gakuji-kyoku Nyuushi Sentaa. (2009). Jouchi Daigaku Kokusai Kouyou Gakubu Nyuushii Pamperetto. Tokyo: Author.

Murphey, T. (2009) Innovative School-Based Oral Testing in Asia. Shiken: JALT Testing & Evaluation SIG Newsletter, 12 (3) 14 - 21. Retrieved November 25, 2009 http://jalt.org/test/PDF/Murphey4.pdf

Nakatsuhara, F. (2008). Inter-interviewer variation in oral interview tests. ELT Journal, 62 (3) 266-275. doi:10.1093/elt/ccm044

Tamamoto, M. (2009, July). Will Japan Ever Grow Up? Retrieved November 25, 2009 from http://www.feer.com/essays/2009/july/will-japan-ever-grow-up

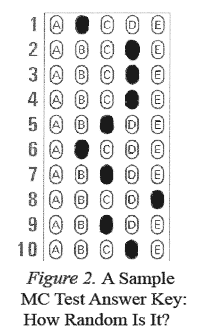
An multiple choice answer sheet that has been balanced, but not randomized 3 Q: (1) What are the pros and cons of balancing the correct answer choice sequences in the answer sheets of fixed-response exams? What alternative ways of organizing multiple-choice key answers currently exist?

   A: Multiple choice test answer sequences can be determined two ways. One way is to have a test designer eyeball the answer key and subjectively balance the correct responses among the response options. This procedure is known as key balancing. Another approach is to have the correct answers randomized mechanically. This is known as key randomization.
* An advantage of key balancing is that it's quick and requires no software – if a test designer feels that a response pattern is more or less random, it can be said to be "balanced". The disadvantage of this approach is that key balanced answer keys are, in fact, often not random: there are unconscious patterns and tendencies to repeat certain sequences. For example, Attal and Bar-Hillel (2002) contend that, "people writing a multiple-choice question tend to place the correct answer in a central position as much as up to 3 to 4 times as often as at an extreme position, apparently with little if any awareness of this tendency" (p. 299). In the same vein, Attal, Budescu, and Bar-Hillel (2005) suggest, "The rules of key balancing mimic those employed by naive people attempting to 'randomize': over-alternation, and short-term balancing that produce 'locally representative' sequences" (p. 11).
* For this reason key randomization is recommended over key balancing. A number of software programs are available to effectively randomize multiple choice tests: Hot Potatoes (Half-Baked Software), Random Test Generator Pro (Hirtle Software), Multiple Choice Quiz Maker (Tac-Software), and Schoolhouse Test (Schoolhouse Technologies) are but a few of the options available. Also, using the "randomize" function in Excel and exporting the results to a word processor is also an option.

Further reading:

[ p. 32 ]

Bar-Hillel, B., & Attali, Y. (2002). Seek whence: Answer sequences and their consequences in key-balanced multiple-choice tests. The American Statistician 56, 299-303. doi: 10.1198/000313002623.

Bar-Hillel, M., Budescu, D., & Attali, Y. (2005). Scoring and keying multiple choice tests: A case study in irrationality. Mind & Society 4 (3) 12. doi: 10.1007/s11299-005-0001-z.

Hot Potatoes (Version 6) [Computer Software]. Victoria, B.C.: Half-Baked Software.

MetaFilter Network. (March 18, 2008). How to shuffle test items in random order in Microsoft Word. Retrieved November 30, 2009 from http://ask.metafilter.com/86477/How-to-shuffle-test-items-in-random-order-in-Microsoft-Word

Multiple Choice Quiz Maker (Version 10.0.0) [Computer Software]. Reutlingen, Germany: Tac-Software.

Random Test Generator Pro (Version 8.3). [Computer Software]. Mesquite, TX: Hirtle Software.

Schoolhouse Test (Version 2). [Computer Software]. Seattle, WA & Vancouver, BC: Schoolhouse Technologies.

4 Q:What would be an appropriate interpretation of a .84 correlation between the TOEIC Bridge (Reading Section) and a test of mathematics ability among 198 high school students?

   A: A question to ask first is "What kind of correlation statistic is actually involved?" There are a number of different correlation statistics that are appropriate for different types of data. Researchers need to state clearly what sort of data is involved and which correlation statistic is most suited for that data. Since different types of correlation statistics often yield different results and not all classroom researchers know which correlation statistic is appropriate for a given experiment, these are questions worth considering.
* If we regarded the TOEIC Bridge and math score test results as two sets of continuous interval data - an interpretation that could very well be disputed - then it would be tempting to apply the Pearson correlation coefficient. However, this statistic is vulnerable to outliers, unequal variances, and distributions that aren't smooth bell curves. There's no reason to assume that the data distribution patterns for either of the two tests mentioned in this study were normal for the relatively small given samples. Readers would have to dig into the data to interpret it accurately: that process is time-consuming. A single statistic without an embedded context can offer only limited information.
* Let's assume the two sets of test scores are ordinal data - a more conservative interpretation that some researchers might question. From a classical test theory perspective, either Spearman's rank order correlation (rho) or Kendall's rank order correlation (tau) would seem like viable options for dealing with such data. Moore (2009, slide 23) recommends using Spearman's Rho for data with over 20 cases and t Kendall's Tau if there are less than 20 cases.
* There are other ways of exploring the correlation of these two tests using multiple regression, factor analysis, discriminant analysis, and of course Rasch analysis. Those are beyond the scope of this paper now. What should be amply clear is that there a number of different ways to explore correlation, and the consensus on which way is most appropriate gradually changes over time.
* Returning to the original question, the apparently high correlation between the EFL scores and math scores of this sample of high school students raises the possibility that both math and verbal skills are related to general intelligence and/or test wiseness. To confirm that hypothesis, however, it would be necessary to review similar studies on different populations.

Further reading:

[ p. 33 ]

Gigawiz. Ltd. (2009). Correlation Methods and Statistics. Retrieved December 1, 2009 from http://www.gigawiz.com/correlations.html

Lohninger, H. (2009, March 29) Fundamentals of Statistics: Spearman's Rank Correlation. Retrieved December 1, 2009 http://www.statistics4u.info/fundstat_eng/cc_corr_spearman.html

Moore, G. (2009). Scientific Inquiry in Agricultural and Extension: Correlations. Retrieved December 1, 2009 http://www.cals.ncsu.edu/agexed/aee578/correlations.ppt


5 Q:What would be an appropriate interpretation of a .84 correlation between the TOEIC Bridge (Reading Section) and a test of mathematics ability among 198 high school students?

   A: Item cloning is a process by which "parent items" in a given test are subjected to various rules to produce new items with the same desired features. The test designer can specify which transformational rules are to be employed to generate new items. A test question such as, "How did you enjoy today's activity?" could be cloned into "How enjoyable was the activity today?" from a pragmatic perspective.
* One word of caution about item cloning is that there is no reason to assume the item difficulty of a parent item and cloned item will be equivalent. Though skillfully cloned items might match each other closely, data is needed to corroborate this.
* In classical test theory, item anchoring is when a specific test item is "seeded" from one test into other tests in order to compare how different groups respond to that item. This is also known as "item linking" (Li, 2008, p. 1). It is not an unusual practice to place a limited number of questions from one test into others to see how different the populations taking those given tests are.
* In confirmatory factor analysis and item response theory, however, item anchoring seems to have a broader meaning. It is a process of comparing the performance of two or more items that are not necessarily identical. For an explanation of this process, refer to Baker and Kim (2004). Since strong claims are made about item performance in CFA and IRT, it is possible to anchor even dissimilar items when dealing with similar samples of respondents

Further reading:

Baker, F. B. & Kim, S. H. (2004). Item Response Theory: Parameter Estimation Techniques (2nd Edition). New York: Dekker.

Li, X. (2008). An investigation of the item parameter drift in the examination for the Certificate of Proficiency in English (ECPE). Spaan Fellow Working Papers in Second or Foreign Language Assessment, 6, 1-28. Retrieved December 8, 2009 from http://www.lsa.umich.edu/eli/research/spaan/SpaanV6Li.pdf

Irvine, S. & Kyllonen, P. (Eds.) (2002). Item Generation for Test Development. Mahwah, NJ: Lawrence Erlbaum Associates, Inc.

Scheerens, J., Glass C., & Thomas, S. M. (2003). Educational evaluation, assessment, and monitoring: A systemic approach. Lisse, The Netherlands: Swets & Zeitling.

Yu, C. H., Osborn, S. E. (2005). Test Equating by Common Items and Common Subjects: Concepts and Applications. Practical Assessment, Research & Evaluation, 10 (4) http://pareonline.net/getvn.asp?v=10&n=4

Part II: Multiple Choice Questions

1 Q: Which concepts below are commonly signified by p?


   A: Unfortunately, all of these items have been symbolized by p at least some place in the literature. The most widely accepted use of p is as a measure of the likelihood of a random occurrence. The p values in most classroom language research studies are set at .05 or .01.
* Though many researchers use ID to indicate item difficulty, some use p. For example, on Prof. Whatley's Tests and Measurements Homepage (http://chiron.valdosta.edu/mawhatley/3900/), the lesson about item analysis opts for p.
* Population size is usually symbolized by N in the field of applied linguistics. However, in the field of biology it is sometimes symbolized p or P (cf. Williamson & Slatkin, 1999; Daily & Ehrlich, 1992).
* Finally, the proportion of students passing a given test is usually simply called the "pass rate", but on occasion authors such Gastwirth, Krieger, and Rosenbaum (1994, pp. 213 - 315) refer to this as p.
* The point being made is that there is some lack of uniformity regarding the use of statistical symbols. Instead of assuming that a symbol such as p has a fixed meaning, it is best to check the context to confirm what it actually represents.

Further reading:

Daily, G. C. & Ehrlich, P. R. (1992). Population, sustainability, and Earth's carrying capacity: A framework for estimating population sizes and lifestyles that could be sustained without undermining future generations. BioScience, 42 (10), 761-771. Retrieved December 4, 2009 from http://dieoff.org/page112.htm

Gastwirth, J., Krieger, A., and Rosenbaum, P. (1994). How a court accepted an impossible explanation. The American Statistician, 48, 313-315.

Whatley, M. A. (n.d.) Tests and Measurements Homepage: Item Analysis. Retrieved December 4, 2009 from http://chiron.valdosta.edu/mawhatley/3900/itemanalysis.pdf

Williamson, E. G. & Slatkin, M. (1999, June). Using maximum likelihood to estimate population size from temporal changes in allele frequencies. Genetics, 152 755 - 761. Retrieved December 4, 2009 from http:// ib.berkeley.edu/labs/slatkin/monty/WilliamsonSlatkin.pdf


2 Q: Which of these statement(s) about the Kuder-Richardshon-21 reliability coefficient is/are considered true?


   A: The first two statements are widely considered true, but the second two false. The reliability estimate of the KR-20 is often lower than the KR-21. The final statement could be said to be true of the KR-20, but not the KR-21.

[ p. 35 ]

* A frequent question among researchers concerns the difference between the KR-20 and KR-21. Simply stated, the KR-20 can be thought of as a short form of the KR-21. According to Lord (1953), it is less accurate than the KR-20. However, since it is so easy to calculate it remains common.
* The differences between these two tests and another common test of reliability, Cronbach's alpha, is summarized in Table 1.

Table 1. A Comparison of Three Widely Used Tests of Reliability.
KR-20 KR-21 Cronbach's Alpha
Used for partial credit items? No No Yes
Assumes test items are of uniform difficulty? No Yes Yes
Single administration? Yes Yes Yes
Assumes all test items measure same skill? Yes Yes Yes
Recommended for speeded tests? No No No

Further Reading:

Lenke, J. M., et al. (1977). Differences between Kuder-Richardson Formula 20 and Formula 21- Reliability coefficients for short tests with different item variabilities. ERIC Document #ED141411. Retrieved November 27, 2009 from http://www.eric.ed.gov/ERICWebPortal/custom/portlets/recordDetails/detailmini.jsp?_nfpb=true &_&ERICExtSearch_SearchValue_0=ED141411&ERICExtSearch_SearchType_0=no&accno=ED141411

Lord, F. M. (1953). The Standard Errors of Various Test Statistics When the Items Are Sampled (Revised Edition). ETS Report Number: RB-53-20.

Yu, A. (n.d.). Using SAS for Item Analysis and Test Construction. Retrieved December 6, 2009 from http://www.creative-wisdom.com/teaching/assessment/alpha.html

3 Q:Which of the following statements are not true about Wald tests?


   A: A Wald test is one way of ascertaining how closely related two or more variables are. The first two statements about Wald tests are generally considered true: they can be used for all types of variables and represent one way of estimating parameters of interest. However, according to Garson (2009, par. 37) likelihood ratio tests are preferred to Wald tests since they are less prone to Type II errors if the effect size is large, but the probability of a random occurrence seems small. Moreover, according to Randall, Woodward, and Bonett (1997) they do require a large sample size when employing multivariate data models. Hence, options (C) and (D) are false.

Further reading:

Garson, D. (2009). Quantitative Research in Public Administration: Logistic Regression. Retrieved December 8, 2009 from http://faculty.chass.ncsu.edu/garson/PA765/logistic.htm

Randall, R. L., Woodward, J. A., & Bonett, D. G. (1997). A Wald test for the multivariate analysis of variance: small sample critical values. Communications in Statistics - Simulation and Computation, 26 (4), 1275 - 1299. doi: 10.1080/03610919708813440

Weiss, J. (2007). Environmental Studies 562 - Statistics for Environmental Science: Lecture 17. http://www.unc.edu/courses/2007spring/enst/562/001/docs/lectures/lecture17.htm

[ p. 36 ]

4 Q: The grading scheme which appears at http://jalt.org/test/SS8c.gif is an example of __________.

   A: The correct answer is (A). All of the options represent different scoring formulas that reward guessing. In confidence marking, examinees note their confidence level next to what they believe to be the correct answer. In a scheme suggested by Davies (2002, pp. 121-123) respondents who feel "very confident" their answer is right can get +5 points if their hunch is correct. Conversely, if they are "very confident" but answer incorrectly, they would receive -2 points.
* Elimination testing is a form of multiple-choice testing in which examinees are asked to mark as many incorrect options for test item questions as they can. They receive +1 point for each incorrect option cited, but -1 point for citing a correct option.
* Liberal multiple-choice test grading permits examinees to select more than one answer option if they feel unsure of the correct choice. Naturally, their score is lowered when selecting multiple options. However, this grading system does reward partial knowledge (or the ability to eliminate distracter items).
* Finally, order-of-preference grading schemes require examinees to weigh the plausibility of available options. This type of grading scheme may be well-suited to multiple-choice tests of pragmatic knowledge in which examinees must evaluate a range of responses for a given prompt that vary in terms of socio-cultural appropriateness, but not grammatical correctness. In such scenarios, instead of thinking of answers as "right or wrong" it is probably best to conceptualize them as "more appropriate and less appropriate".

Further reading:

Davies, P. (2002). There's no Confidence in Multiple-Choice Testing. Proceedings of 6th CAA Conference, Loughborough: Loughborough University, pp. 119 - 130. http://www.lboro.ac.uk/service/ltd/flicaa/conf2002/pdfs/davies_p1.pdf

Ng, A. W. Y. & Chan A. H.S. (2009). Different methods of multiple-choice test: Implications and design for further research. Proceedings of the 2009 International MultiConference of Engineers and Computer Scientists. March 18 - 20, 2009, Hong Kong. Retrieved December 1, 2009 from http://www.iaeng.org/publication/IMECS2009/IMECS2009_pp1958-1963.pdf
5 Q: Which of the following statements are true about parameter drift?

   A: AParameter drift, a concept espoused by Goldman in 1983, can be likened to a form of "information entropy" in which statistical properties of a given set of test items change over time. Any test which involves item pooling and repeated administrations over time should be concerned about parameter drift. According to Li (2008), significant parameter drift can be detected through classical item analysis as well as some forms of IRT.
All of the options mentioned above are true of parameter drift.

[ p. 37 ]

Further reading:

Brown, J. D. (2003). Norm-referenced item analysis (item facility and item discrimination). Shiken: JALT Testing & Evaluation SIG Newsletter, 7 (2) 16, 19. Retrieved April 16, 2009 from http://jalt.org/test/PDF/Brown17.pdf

DeMars, C. E. (2004). Detection of Item Parameter Drift over Multiple Test Administrations. Applied Measurement in Education, 17 (3) 265 - 300. doi: 10.1207/s15324818ame1703_3

Goldstein, H. A. R. V. (1983). Measuring changes in educational attainment over time: Problems and possibilities. Journal of Educational Measurement, 20 (4), 369-377.

Li, X. (2008). An investigation of the item parameter drift in the examination for the Certificate of Proficiency in English (ECPE). Spaan Fellow Working Papers in Second or Foreign Language Assessment, 6, 1-28. Retrieved December 8, 2009 from http://www.lsa.umich.edu/eli/research/spaan/SpaanV6Li.pdf

Van der Linden, W. & Glas, G. A. W. (Eds.) (2000). Computerized Adaptive Testing: Theory and Practice. Boston, MA: Kluwer.


NEWSLETTER: Topic IndexAuthor IndexTitle IndexDate Index
TEVAL SIG: Main Page Background Links Network Join
last Main Page next
HTML: http://jalt.org/test/SSA8.htm   /   PDF: http://jalt.org/test/PDF/SSA8.pdf
ASSESSMENT LITERACY ONLINE SELF-STUDY SERIES:

Quiz 1: Qs   / As   *    2: Qs   / As   *    3: Qs   As   *    4: Qs   As   *    5: Qs   / As   *    6: Qs   / As   *    7: Qs   / As   *    8: Qs   / As   9: Qs   / As   *    10: Qs   / As  

[ p. 38 ]