Shiken:JALT Testing & Evaluation SIG Newsletter
Vol. 7 No. 3. Dec. 2003. (p. 18 - 24) [ISSN 1881-5537]
PDF PDF Version

Statistics Corner
Questions and answers about language testing statistics:

Criterion-referenced item analysis
(The difference index and B-index)

Photo of JD Brown, c. 2000
James Dean Brown
University of Hawai'i at Manoa


* QUESTION: Can you explain the distinction between a difference index and a B-index? When should these indices be used? When should they not be used? (You mentioned the use of B-index on page 212 of your article (Brown, 2001) in the book A Focus on Language Test Development that you edited with Thom Hudson.)

* ANSWER: Your question fits neatly with the question I addressed in my last Statistics Corner column. I really can't answer your question without first repeating the brief introduction (from the previous column) about the purpose of item analysis in revising and improving language tests.

The Purpose of Item Analysis

* The development of any language test is a major task just like other aspects of language curriculum development. Such projects are usually accomplished in the following steps:
  1. Assemble or write a relatively large number of items of the type you want on the test.

  2. Analyze the items carefully using item format analysis to make sure they are well-written and clear (for guidelines, see Brown, 1996, 1999; Brown & Hudson, 2002).

  3. Pilot the items using a group of students similar to the group that will ultimately be taking the test (under less than ideal conditions, this may actually be the first operational administration of the test).

  4. Analyze the results statistically using item analysis techniques. These were described in the previous column for norm-referenced tests (NRTs) and are described below for criterion-referenced tests (CRTs).

  5. Select the most effective items (and get rid of the ineffective items) and make a shorter, more effective revised version of the test.

Item Analysis Statistics for Criterion-Referenced Tests

[ p. 18 ]

* The fourth step in the above list – item analysis – is different for NRTs and CRTs. In the previous column, I explained how that step works for NRTs. In this column, I will explain item analysis for CRTs. Recall that the basic purpose of CRTs is to measure the amount (or percent) of material in a course or program of study that students know (or can do), usually for purposes of making diagnostic, progress, or achievement decisions (for much more on this topic, see Brown, 1995a, 1996, 1999; Brown & Hudson, 2002). Two item statistics are often used in the item analysis of such criterion-referenced tests: the difference index and the B-index.
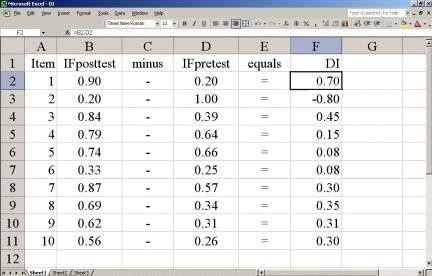
"the difference index shows the gain, or difference in performance, on each item between the pretest and posttest."

* The difference index is defined as the item facility on the particular item for the posttest minus the item facility for that same item on the pretest. [Recall that the definition of item facility is the proportion of students who answered a particular item correctly.] In other words, the difference index shows the gain, or difference in performance, on each item between the pretest and posttest. Calculating the difference index (DI) goes like this: if 10 out of 50 students answered Item 1 correctly on the pretest for a course, the pretest item facility (IFpretest) would be 10/50 = .20; if 45 out of the same 50 students answered that same item correctly on the posttest, the posttest item facility (IFposttest) would be 45/50 = .90. Given that IFposttest = .90 and IFpretest = .20, the DI would be .70 (DI = IFposttest - IFpretest = .90 - .20 = .70).

[ p. 19 ]

* Notice in Screen 1 that I have calculated the DI for Item 1 using my spreadsheet program. I did so by typing in the item numbers, then lining up my posttest and pretest item facilities as shown. Then, in cell F2, I typed =B2-D2 and hit the ENTER key. In other words, I subtracted the IFposttest minus the IFpretest and got .70 as my result. Once the calculation in cell F2 was completed, I blocked and copied that cell (using CONTROL C to do so) and pasted that into cells F3 to F11 (by blocking them out and hitting CONTROL V). That copying yielded the other DI values. The DI tells me how much the students are improving between the pretest and posttest on each item (and by extension, on the related curriculum objective). Like the item discrimination statistic discussed in the previous column, the higher the value of the DI, the better. Indeed a value of 1.00 is a perfect difference index. Thus, in Screen 1, items 1, 3, and 7-10 are much better related to the curriculum than are items 2, and 4-6 because they have higher values. Items 4-6 are not fitting because they reflect only small gains (i.e., their values are very low); item 2, which has a negative value, indicates that, somehow, during the course, 80% of the students who started out knowing this item unlearned it by the end of the course.

Screen 1: The NRT Item Analysis
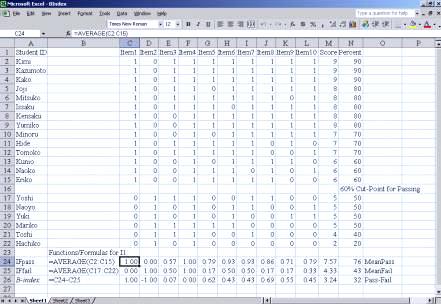
"the B-index shows how well each item is contributing to the pass/fail decisions that are often made with CRTs."
Screen 1: Calculating the DI in a Spreadsheet

* In contrast, the B-index is defined as the item facility on the particular item for the students who passed the test minus the item facility for the students who failed. In other words, the B-index shows how well each item is contributing to the pass/fail decisions that are often made with CRTs. For example, if 14 out of the 14 students who passed the test answered Item 1 correctly, the item facility for students who passed (IFpass) would be 14/14 = 1.00; if none of the six students who failed the test answered that same item correctly, the item facility for students who failed (IFfail) would be 0/6 = .00. Given that IFpass = 1.00 and IFfail = .00, the B-index for this particular item would be 1.00 (B-index = IFpass - IFfail = 1.00 - .00 = 1.00).

[ p. 20 ]

* Notice in Screen 2 that I have calculated the B-index for Item 1 using my spreadsheet program. I arranged my data by typing labels for Student ID and the item numbers across the first row. Then, I typed in all the students' names, as well as 1s for items they answered correctly and 0s for items they answered incorrectly. I next calculated the total score for each student and rank-ordered the students from highest to lowest scores. Finally, to make it easy to visualize the passing and failing groups, I put a blank row between those who passed (i.e., scored above the 60% cut-point in this case) and those who failed.

Screen 1: The NRT Item Analysis
Screen 2: Calculating the B-index in a Spreadsheet

* To calculate the B-index, I began by labeling the three rows from A24 to A26 as follows: IFpass, IFfail, and B-index. Then I typed functions/formulas into cells C24, C25, and C26 as shown next to each cell in Screen 2. After typing each formula, I hit the ENTER key and moved on to the next one. Once the three formulas were typed into cells C24 to C26, I blocked them, copied them (again, I used CONTROL C to do so), and pasted them into cells D24 to L26 (by blocking those cells out and hitting CONTROL V). For each item, I now had the item facility for those students who passed the test, the item facility for those who failed, and the B-index for each item. The B-index tells me how well each item is contributing to the pass/fail decision on this test at this cut-point. Like the item discrimination and difference index statistics, the higher the B-index, the better. A perfect B-index would be 1.00.

[ p. 21 ]

Conclusion

* In direct answer to your question: yes, I can explain the distinction between a difference index and a B-index, as you can see above.
* When should these indices be used? They should be used to analyze the items on a criterion-referenced test for purposes of revising the test. In both cases, the items with the highest values should generally be kept. However, making these decisions is not nearly as simple as it is for NRT development because a CRT item may not be performing well in terms of these statistics for many reasons: (a) perhaps the item is written/working poorly, (b) maybe the objective the item is testing is vague, (c) perhaps the students are not yet ready to learn this particular objective, (d) maybe one – or all – of the teachers are not teaching this particular objective, or are teaching it poorly, (e) perhaps the materials are confusing with regard to this particular objective, or (f) maybe some combination of the above factors is at work. So, these item statistics can point you to places in your curriculum where something is not working well, but they cannot tell you exactly what is wrong. You will have to do some common-sense analysis of the entire situation in deciding how to revise your criterion-referenced test and/or other aspects of your curriculum (aspects like the objectives themselves, the materials, the teaching, etc.; for more on these curriculum elements, see Brown, 1995b).
* However, the statistics explained in this column should help you figure out where to focus your energies. Generally, the difference index will tell you how well each item fits the objectives of your curriculum, and the B-index will tell you how well each item is contributing to the pass/fail decision that you must make at whatever cut-point you are using.
"Generally, the difference index will tell you how well each item fits the objectives of your curriculum, and the B-index will tell you how well each item is contributing to the pass/fail decision that you must make at whatever cut-point you are using."

* The word "criterion" in criterion-referenced test has been defined in two ways in the literature. One definition is that criterion refers to the material being taught in the course. Thus criterion-referenced testing would assess the particular learning points of a particular course or program. This definition fits very well with the difference index, which indicates how well each item fits the objectives of the curriculum.

[ p. 22 ]

* The other definition is that the criterion is the standard of performance (or cut-point for decision making) that is expected for passing the test/course. Thus criterion-referenced testing would be used to assess whether students pass or fail at a certain criterion level (or cut-point). This definition fits very well with the B-index, which indicates how well each item is contributing to the pass/fail decision that you must make at whatever cut-point your are using.
* Clearly, if you are primarily interested in the degree to which your items are reflecting the material in your courses (the first definition), you should focus on the difference index. If you are primarily interested in the degree to which your items are helping you make decisions at a certain cut-point (the second definition), you should focus on the B-index. If you are interested in both aspects of criterion-referenced testing at the same time, you will need to use both statistics.
* When should they not be used? These particular statistics should probably not be used to analyze the effectiveness of norm-referenced items (for one exception where the DI statistic was used in combination with item facility and discrimination to develop an NRT that "fit the curriculum," see Brown, 1989). The ultimate goal is to produce a curriculum and CRTs that match each other such that you get high difference indexes and high B-indexes.
* For more information on using item analysis to develop CRTs, see Brown (1996, 1999) or Brown and Hudson (2002). For information that will help you calculate CRT item statistics for weighted items (i.e., items that cannot be coded 1 or 0 for correct and incorrect), see Brown (2000). For examples of CRT development and revision projects, see Brown (1993, 2001).

References

Brown, J. D. (1989). Improving ESL placement tests using two perspectives. TESOL Quarterly, 23(1) 65-83.

Brown, J. D. (1993). A comprehensive criterion-referenced language testing project. In D. Douglas & C. Chapelle (Eds.) A new decade of language testing research (pp. 163-184). Washington, DC: TESOL.

Brown, J. D. (1995a). Differences between norm-referenced and criterion-referenced tests? In J. D. Brown & S. O. Yamashita (Eds.). Language testing in Japan (pp. 12-19). Tokyo: Japan Association for Language Teaching.

[ p. 23 ]

Brown, J. D. (1995b). The elements of language curriculum: A systematic approach to program development. New York: Heinle & Heinle Publishers.

Brown, J. D. (1996). Testing in language programs. Upper Saddle River, NJ: Prentice Hall.

Brown, J. D. [trans. by M. Wada]. (1999). Gengo tesuto no kisochishiki. [Basic knowledge of language testing]. Tokyo: Taishukan Shoten.

Brown, J. D. (2000). Statistics Corner. Questions and answers about language testing statistics (How can we calculate item statistics for weighted items?). Shiken: JALT Testing & Evaluation SIG Newsletter, 3(2), 19-21. Retrieved from the World Wide Web at http://jalt.org/test/bro_6.htm on 15 April 2003.

Brown, J. D. (2001). Developing and revising criterion-referenced achievement tests for a textbook series. In T. Hudson & J. D. Brown (Eds.). A focus on language test development: Expanding the language proficiency construct across a variety of tests. Honolulu, HI: University of Hawai'i Press.

Brown, J. D., & Hudson, T. (2002). Criterion-referenced language testing. Cambridge: Cambridge University Press.


Where to Submit Questions:
Please submit questions for this column to the following e-mail or snail-mail addresses:

brownj@hawaii.edu

JD Brown, Department of Second Language Studies
University of Hawaii at Manoa
1890 East-West Road, Honolulu, HI 96822 USA


NEWSLETTER: Topic IndexAuthor IndexTitle IndexDate Index
TEVAL SIG: Main Page Background Links Network Join
STATISTICS CORNER ARTICLES:
#1   #2   #3   #4   #5   #6   #7   #8   #9   #10   #11   #12   #13   #14   #15   #16   #17   #18   #19   #20   #21   #22   #23   #24   #25   #25   #26   #27   #28   #29   #30   #31   #32   #33   #34  
last Main Page next
HTML: http://jalt.org/test/bro_18.htm   /   PDF: http://jalt.org/test/PDF/Brown18.pdf

[ p. 24 ]