Shiken:JALT Testing & Evaluation SIG Newsletter
Vol. 5 No. 3. Oct. 2001 (p. 12 - 16) [ISSN 1881-5537]
PDF Version
Point-biserial correlation coefficients |
 James Dean Brown University of Hawai'i at Manoa |
[ p. 12 ]
| Table 1. Types of Correlation Coefficients | |
| Correlation Coefficient | Types of Scales |
| Pearson product-moment | Both scales interval (or ratio) |
| Spearman rank-order | Both scales ordinal |
| Phi | Both scales are naturally dichotomous (nominal) |
| Tetrachoric | Both scales are artificially dichotomous (nominal) |
| Point-biserial | One scale naturally dichotomous (nominal), one scale interval (or ratio) |
| Biserial | One scale artificially dichotomous (nominal), one scale interval (or ratio) |
| Gamma | One scale nominal, one scale ordinal |
[ p. 13 ]
| Table 2. Example Student Data | |||||
| Student | Item 1 | Item 2 | Item 3 | Item 4, 5, 6... | Total Score |
| Hachiko | 1 | 0 | 1 | . . . | 50 |
| Kazuko | 1 | 0 | 1 | . . . | 45 |
| Toshi | 1 | 0 | 1 | . . . | 45 |
| Yoshi | 1 | 0 | 1 | . . . | 40 |
| Tomoko | 0 | 1 | 1 | . . . | 35 |
| Yasuhiro | 0 | 1 | 1 | . . . | 30 |
| Yuichi | 0 | 1 | 1 | . . . | 30 |
| Masa | 0 | 1 | 1 | . . . | 25 |
| Mp | 45 | 30 | 37.5 | Total mean | 37.50 |
| Mq | 30 | 45 | .00 | Standard Deviation | 8.29 |
| p | .50 | .50 | 1.00 | ||
| q | .50 | .50 | .50 | .00 | |
| rpbi | .91 | -.91 | .00 | ||
[ p. 14 ]
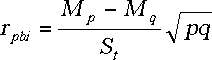
Where:| rpbi = | point-biserial correlation coefficient |
| Mp = | whole-test mean for students answering item correctly (i.e., those coded as 1s) |
| Mq = | whole-test mean for students answering item incorrectly (i.e., those coded as 0s) |
| St = | standard deviation for whole test |
| p = | proportion of students answering correctly (i.e., those coded as 1s) |
| q = | proportion of students answering incorrectly (i.e., those coded as 0s) |
![]()
![]()
![]()
[ p. 15 ]
| Table 3. Example Item Analysis (for 32 students) |
||||
| Item # | IF | rpbi | * = p < .05 | |
| 1 | 0.930 | 0.153 | ||
| 2 | 0.656 | 0.295 | * | |
| 3 | 0.882 | 0.122 | ||
| 4 | 0.738 | 0.189 | ||
| 5 | 0.455 | 0.310 | * | |
| 6 | 0.838 | 0.394 | * | |
| 7 | 0.684 | 0.469 | * | |
| 8 | 0.552 | 0.231 | ||
| 9 | 0.581 | 0.375 | * | |
| 10 | 0.398 | 0.399 | * | |
| 11 | 0.926 | 0.468 | * | |
| 12 | 0.774 | 0.468 | * | |
| 13 | 0.663 | 0.414 | * | |
| 14 | 0.862 | 0.276 | ||
| 15 | 0.624 | 0.205 | ||
[ p. 16 ]