Shiken:JALT Testing & Evaluation SIG Newsletter
Vol. 6 No. 3. Sep. 2002. (p. 15 - 21) [ISSN 1881-5537]
PDF Version

Statistics Corner
Questions and answers about language testing statistics:

Distractor efficiency analysis on a spreadsheet

Photo of JD Brown, c. 2000
James Dean Brown
University of Hawai'i at Manoa


* QUESTION: In your testing book (Brown, 1996), you show an example of distractor efficiency analysis, and you explain that you do it by calculating the proportion of people who chose each option on each item. How can I do such an analysis in my spreadsheet program, and how should it be interpreted?

* ANSWER: Let me rephrase your questions a bit and address them in the following order: For multiple option items like multiple-choice items, the traditional item analysis for norm-referenced tests, including item facility and item discrimination analyses, can usefully be supplemented by a distractor efficiency analysis. Basically, you just need to (a) calculate the item analysis statistics (including item facility and item discrimination), (b) compute the proportion of people in the High, Middle, and Low groups who selected each option (say, A, B, C, & D), and then (c) use that information to help you decide which items and options are working and which are not. Let's look at those three steps one at a time from the perspective of the spreadsheet approach you asked about.

Setting up the Spreadsheet

To begin with, look at the very small data set shown in Screen 1. This data set was created using the Exceltm spreadsheet. Notice that the students are arranged from the best student, Hide, at the top with his score of 94, to the worst student, poor hapless Hachiko, who (though dogged and loyal) scored a miserable 25 points. Notice also that I formed three groups along the range of abilities: the High, Middle, and Low groups with 5, 6, and 5 students, respectively, and that I left empty rows between groups so I can see them easily. Much of traditional norm-referenced item analysis involves comparing the performances of the High and Low ability groups. Note also that each student's A, B, C, or D choice is entered as the data instead of the 1s and 0s that are often used to code correct and incorrect answers in such spreadsheet analyses. Finally, notice that I have spread the items out with four blank columns between items so I will later have room to work on my distractor efficiency analysis.

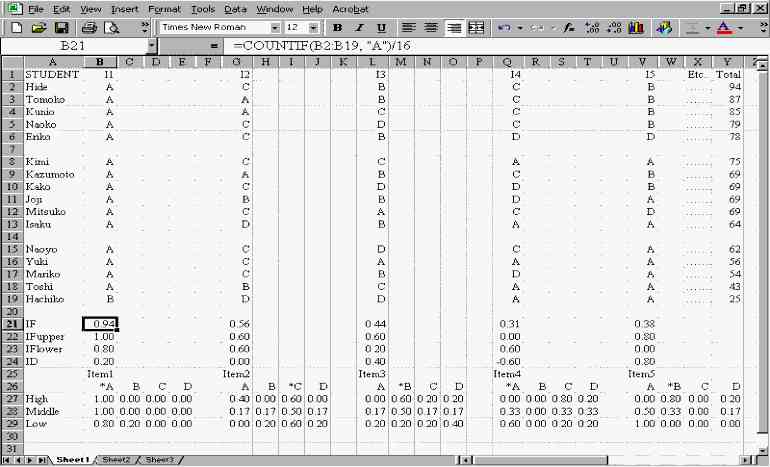
Screen 1: The Setup for Distractor Efficiency Analysis

[ p. 20 ]

Item Analysis in a Spreadsheet

Let's begin with the item analysis statistics. The first step is to put labels in the first column for IF, IFupper, IFlower, and ID (if you need a review of these norm-referenced item analysis statistics see Brown 1996, 1999, or 2000). In Screen 1, the cursor is in cell B21 (as indicated by the darkened edges of that cell). You can see in the formula box in the third row at the top of the spreadsheet that the formula being used in cell B21 is =COUNTIF(B2:B19, "A")/16. This means: count up all the cells containing "A" in the range between B2 and B19, then divide the result by 16. Since "A" is the correct answer, the result of this formula will be the item facility value (i.e., count up the number of correct answers in the range between B2 and B19, then divide the result by the total number of students taking the test).

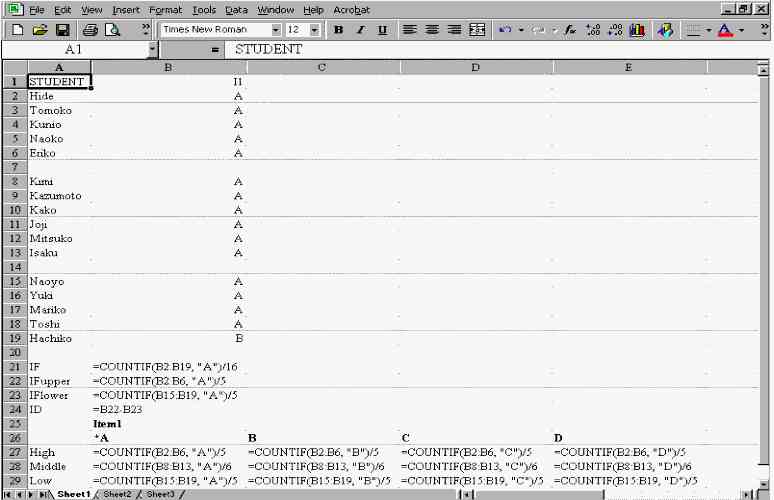
Screen 2: Formulas for Distractor Efficiency Analysis of Item One

[ p. 21 ]

Cell B21 of Screen 2 shows how the IF for item one is calculated using = COUNTIF (B2:B19, "A")/16, or the average of correct answers for all students taking the item. Simply enter the formula shown in cell B21 and hit the <enter> key. The number .94 should appear (as shown in the same cell in Screen 1). Screen 2 also shows the calculation of IFupper using a similar formula in cell B22, but for the range that includes only the top five students (B2 : B6); calculation of IFlower in cell B23 is similar, but for the bottom five students (B15 : B19). Cell B24 shows the calculation of ID, which is IFupper - IFlower, or in this case, = B22 - B23.
In the process of doing the above, you may have one of the following two problems:
  1. Your numbers may have the wrong number of digits to the right of the decimal place. To get two digits to the right of the decimal use the following menus: Format, Cells, select Number, Category, again select Number, Decimal, and change the number in the box to 2; then click the okay button.

  2. Your columns may be too wide or two narrow (especially if a series of number signs, ###, appear in some cells) in which case you should try Format, Column, Width, and changing the number in the box to a larger number; then click the okay button].
Once you have done the item analysis statistics for item one and you are completely satisfied with it, the next step is to copy the block of statistics from B21 to B24 to the same position below item two, then copying that block to the same position below item three, and so forth. Unfortunately, since the option that is correct is different for each item, to finish this process, you will have to manually change (using the F2 key to access the formula) the portion in quotes in the IFupper, IFlower, and ID formulas to reflect the correct answer for each item.

Distractor Efficiency Analysis in a Spreadsheet

To do the distractor efficiency analysis, you will need to type in the formulas you see for item one in the bottom three rows of Screen 2. Notice that the formulas are the same from column to column for the A, B, C, and D options except that the letter in quotes varies, and that the formulas are the same from row to row for the High, Middle, and Low groups, except for differences in the ranges and number used to divide.
Once you have typed in the labels and formulas for all four options and three groups for item one (those shown in the rectangular set of cells with B25 and E29 at the corners), your next step is to block out the same cells and copy them to exactly same position below item two, then copy that block to the same position below item three, and so forth. With a few changes to the item numbers and the placement of the asterisk indicating the correct answer, you should now have a complete distractor efficiency analysis for this extremely short example test.

Interpreting Item and Distractor Efficiency Analyses

The next step is to interpret the results of your distractor efficiency analysis. If you have been following this example in your spreadsheet, your results should look like those in Screen 1. Notice that the analysis of the proportion of students selecting each option in each group for item one indicates that 100 percent of the students in the high and middle groups chose A, while 80 percent of the students in the low group chose A. The other 20 percent of the low students apparently chose option B. Since the asterisk indicates the option that was correct, this item appears to have been very easy with even the vast majority of the low students answering it correctly. This is confirmed by the high IF value of .94, which in turn indicates that the item was easy overall because 94 percent of the students answered it correctly. Note also that subtracting the percent of students in the upper group who correctly answered minus the same figure for the lower group corroborates the ID reported for this first item (ID = IFupper - IFlower = 1.00 - .80 = .20). At first glance, this item might seem too easy for norm-referenced purposes with the group of students involved, and since it is not discriminating well and options C and D appear to be drawing no students, you might want to eliminate it from future versions of the test. However, from a commonsense point of view, you might instead decide that you want to have an easy first item so that students can get off to a good start. As with all item analyses, the decision is yours, but the IF, ID, and distractor analyses can certainly help in making such decisions.

[ p. 22 ]


For instance, in item two, option C is the correct answer with the majority (60 percent) of the high group choosing that answer. However, the other 40 percent of the high group selected a wrong answer, option A. In a situation like this, you might want to go back to the original item and examine it carefully from both format and content points of view. The high group may be attracted to both A and C because they are both correct answers (or both very nearly correct). If this is the case, the best strategy would be to change option A so that it is more clearly wrong or revise C so that it is more clearly correct. Doing either should help strengthen the item and increase its ID in future administrations of the test.
Item three looks like a good item with a reasonably well centered IF (.44) and relatively high ID (.40). This item seems to be a bit difficult, but the distractor efficiency analysis indicates that a majority of the high group is answering this item correctly with the middle group doing less well and the low group doing poorly. This is the sort of pattern of answers I like to see for a norm-referenced test. Note also that all three distractors seem to be about equally attractive to those students who did not answer correctly. If item three continues to look good in terms of content and format, then I would probably keep it in the revised version of the test even though it is a bit difficult.
Item four provides an example of an item with one distractor that is not attracting any of the students. Clearly, distractor B is not carrying its weight in the process of testing the students. But, since the item is very difficult (IF = .31) and appears to be discriminating in the opposite direction from the rest of the test (ID = -.60), the weakness of option B is the least of my problems. However, a quick look at option C makes me wonder why it looks like the pattern I might expect for a correct answer (High group doing best, then Middle group, then Low group). Is it possible that this item is miskeyed? Option C is behaving more like the correct answer than A is, even though A has the asterisk. If examination of the item itself confirms that item four is miskeyed, then changing the answer key and reanalyzing the item would be in order (in this case resulting in an IF of .44 and an ID of .60 for the newly keyed item).
Item five looks like a reasonably sound item, though option C is not attracting any students, so I would want to have a look at that option to see if I can make it more attractive to those students who do not know the correct answer.
Note that the approach employed here (i.e., using the =COUNTIF function) is just one way to do these analyses. By experimenting with the various functions in your spreadsheet program, you may find a strategy that you like much better.

Conclusion

Generally speaking, the item analysis statistics of IF and ID help me to decide which items to keep and which to discard in creating a new revised version of the test. However, the distractor efficiency analysis is also useful for spotting items that are miskeyed and for tuning up those items that have options that are not working as would be expected. Naturally, whether or not I decide to keep an item depends on how high the IDs are for all the other items and how many items I need in the revised version of the test. If many other items have IDs that are higher than the item I am examining, I may decide to throw it out, even though it is not such a bad item, because it is adding very little to the test (other than length). Again, the content and format analyses by direct observation of the items themselves should figure into all of these decisions.
Please keep in mind that my example items in this article were designed to exemplify certain types of problems that distractor efficiency analysis can help you solve. As a result, most of the items were not functioning very well. Typically, in the real world, when a set of items is carefully developed by experienced teachers to suit a particular group of students in a particular situation, a much higher percentage of the items will be found to be working and can therefore be retained in the revised version of the test. However, the types of problems exemplified here do arise and distractor efficiency analysis in your spreadsheet can help you spot them.

References
Brown, J. D. (1996). Testing in language programs. Upper Saddle River, NJ: Prentice Hall.

Brown, J. D. (translated into Japanese by M. Wada). (1999). Gengo tesuto no kisochishiki [Basic knowledge of language testing]. Tokyo: Taishukan Shoten.

Brown, J. D. (2000). Statistics Corner. Questions and answers about language testing statistics (How can we calculate item statistics for weighted items?). Shiken: JALT Testing & Evaluation SIG Newsletter, 3(2), 19-21. Retrieved on July 1, 2002 from the World Wide Web at http://jalt.org/test/bro_6.htm.

Where to Submit Questions:
Please submit questions for this column to the following address:
JD Brown
Department of Second Language Studies
University of Hawai'i at Manoa
1890 East-West Road
Honolulu, HI 96822 USA


[ p. 23 ]


NEWSLETTER: Topic IndexAuthor IndexTitle IndexDate Index
TEVAL SIG: Main Page Background Links Network Join
STATISTICS CORNER ARTICLES:

#1   #2   #3   #4   #5   #6   #7   #8   #9   #10   #11   #12   #13   #14   #15   #16   #17   #18   #19   #20   #21   #22   #23   #24   #25   #25   #26   #27   #28   #29   #30   #31   #32   #33   #34  
last Main Page next
HTML: http://jalt.org/test/bro_15.htm   /   PDF: http://jalt.org/test/PDF/Brown15.pdf