Shiken: JALT Testing & Evaluation SIG Newsletter
Vol. 9. No. 2. October 2005. (p. 8 - 20) [ISSN 1881-5537]
PDF PDF Version


Student and teacher perceptions of learning needs: A cross analysis

Keita Kikuchi
College of International Relations, Nihon University

Abstract

This paper explores a recent needs analysis conducted at one campus of Japan's largest university. Responding to related questionnaires, 434 students and 26 Japanese EFL teachers and 27 native EFL teachers were asked a number of questions concerning their ideas about learning, testing, and teaching. Results revealed both the successes and failures of the school curriculum to satisfy the expectations and desires of students. It also showed ways that these three populations differ and provided valuable insights for directions for further curriculum development.

Keywords: curriculum development, needs analysis, program evaluation, survey methods, course design
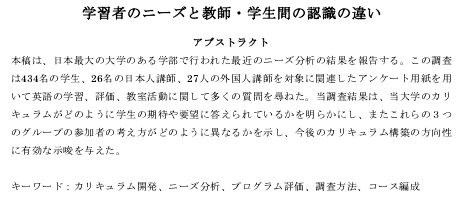
Japanese title, abstract, and keywords


1. Introduction


Although needs analysis (also called needs assessment) is claimed to be a critical part of the process of curriculum planning in second language learning (Brown, 1995; Richards, 2001), there are not so many published studies on this topic. In 1994, in his overview of needs analysis studies, West (1994) stated only a handful of needs analysis studies have come out over the last 25 years. In the past decade, however, there has been an increase in such studies. For instance, there have been quite a few articles concerning the identification of students' needs in English programs in Japanese university classrooms (e.g., Busch, Elsea, Gruba, & Johnson, 1992; Hayasaka, 1995; Kumazawa. 2003; Kusanagi & Kumazawa, 2004; Kuwabara, Nakanishi, & Komai, 2005; Nishihori, 1994; Tachiki, 2002; Yonesaka, 1994).

[ p. 8 ]

Most of these studies, however, only use one method and one data source. Except for Busch, et al, which employed both teacher and student questionnaires, all other studies were based solely on student self-reports. In his book on the curriculum development, Brown (1995, p. 52) states:

. . . multiple sources of information should be used in a needs analysis — although the specific combination appropriate for a given situation must be decided on the site by the needs analysists themselves (probably after input from program administration, faculty, and perhaps students).

If possible, it is important to use different research methods and sources to analyze needs. Although there have been a number of studies in Japan using student questionnaires to obtain student information, such data has limited depth. How cognizant are most 18 or 19-year-old learners of their own learning needs? How willing are they to state their views openly? In the light of such questions, authors such as West (1994), Brown (1995), Long (1999), as well as Witkin and Asltschuld (1995) have emphasized the importance of triangulating data from many sources and using multiple methods. Kikuchi (2001) provides one example of such research.

2. Research Questions


This paper explores the following research questions:
  1. What are students' preferred English learning styles and expectations of teachers?
  2. What are student attitudes toward assessment?
  3. How well are native and non-native English teachers at the Mishima campus of Nihon University supporting students' learning needs?
  4. How differently do students in advanced, intermediate, and basic level classes perceive their learning needs?

3. Method


3.1 Participants

This study uses three research populations: (1) 434 freshmen students at Nihon University's College of International Relations in Mishima City, Shizuoka Prefecture, (2) 26 Japanese teachers of English, and (3) 27 native teachers of English. Information about these three populations is summarized in Figures 1 - 3.

[ p. 9 ]


Figure 1
Figure 1. The age and educational background of the student respondents

Figure 1
Figure 2. The age and teaching experience of the Japanese teachers of English

Figure 1
Figure 3. The age and teaching experience of the native teachers of English


3.2 Materials

The student questionnaire consisted of one hundred 5-point Likert scale questions in Japanese. Those parts relevant to this paper appear in Appendix 1A, along with an English translation and the mean scores and standard deviations of the responses. This questionnaire was based on a survey developed by Busch, et al. (1992) to identify the needs of students at Kanda University of International Studies. A few items from the original Busch et al. study were deleted because of they were not relevant to the NUM program and three background questions were added to obtain more information about the participants.

[ p. 10 ]


The teacher questionnaires consisted of fifty 5-point Likert scale questions in English. This was also adapted from Busch, et al. (1992), though a few items from that original study were deleted and three extra background questions were added. Questions from that survey relevant to this paper along with the mean scores and standard deviations of the responses appear in Appendix 2.

3.3 Procedures

In early December 2004, the questionnaire appearing in Appendix 1A was distributed to 706 freshmen enrolled in a mandatory English IV class. The students had twenty minutes in class to complete the survey. 61% of the students (n=434) completed the questionnaire. At the same time, the questionnaire appearing in Appendix 2 was distributed to 26 Japanese teachers of English and 27 native speakers of English. They were asked to complete this survey in their free time within a one-week time frame. 69% of the Japanese teachers (n=18) and 63% of the native teachers (n=17) completed the survey.

4. Results

4.1 Students preferred learning styles and expectations about their teachers.

The first 28 items in the survey concerned attitudes about learning and how teachers should perform. There was a strong preference for the conditions mentioned in Questions 1, 7, 10, 11, 13, 16, 17, 22 and 25 and less preference for those mentioned in Questions 3, 27, and 28. If this data is accurate, it would seem that students prefer to learn under so-called "communicative" conditions with an emphasis on pair/group work, fun learning, individual help from teachers, with a positive classroom atmosphere. Many students also seem to enjoy translation exercises and immediate error correction. Not many liked the way they learned English in high school, and strict teachers were not appreciated. Table 1 summarizes salient responses. On the right side of the each statement, means of the students placed in advanced (Adv), intermediate (Int), and basic (Bas) levels are described so that readers can identify the similarity/difference in responses among these different groups.

[ p. 11 ]


Table 1. Summary of Agreed and Less Agreed items in students' preferred learning styles and expectations about their teachers

Preferred Conditions (General mean scores above 3.5)
Survey
Item #
Statement Mean
(Adv)
Mean
(Int)
Mean
(Bas)
22   I learn best when the teacher makes learning fun. 4.48 4.33 3.93
25  I learn best when I chose what work I would like to do. 4.03 4.17 3.94
7   I like the teacher to correct all my mistakes immediately. 4.12 3.89 3.72
16   I learn best when the teacher lets me discover answers by myself rather than just hearing them. 4.03 3.93 3.55
13   I learn best when I see the words rather than just hearing them. 3.78 3.85 3.70
11   I learn best when we have translation exercises. 3.63 3.86 3.71
17   I learn best when there is a friendly atmosphere in the classroom. 3.90 3.77 3.55
1   I like to work with other students in pairs and small groups. 3.95 3.85 3.32
10   I learn best when the teacher moves around the class and helps individual students. 3.65 3.63 3.38
Less Preferred Conditions (General mean scores lower than 2.8)
28   I use the library/LL self-study rooms to study English. 2.92 2.66 2.80
27   I like the way I was taught English in high school. 2.18 2.55 2.91
3   I learn best when the teacher is strict and controls the lesson.
(I like teachers who are very strict).
2.66 2.56 2.47


4.2 Student attitudes toward assessment/evaluation

Survey items 73 to 82 covered students' views on assessment/evaluation. Table 2 summarizes the descriptive statistics. Generally, students seem to prefer taking a series of small quizzes rather than large tests. They appear to be interested in learning test-taking strategies. Most have not taken computer-based tests and do not plan to take any English proficiency tests soon. It seems they disdain essay tests focusing on productive language skills.


Table 2. Summary of agreed and less agreed items in students' self-reported views of assessment/evaluation.

Preferred Conditions (General mean scores above 3.5)
Survey
Item #
Statement Mean
[Adv]
Mean
[Int]
Mean
[Bas]
73   I prefer taking a series of small quizzes rather than one large test. 3.78 3.78 3.74
75   I would like to know more about test taking strategies. 3.54 3.93 3.94
80   I want my teacher to teach me how to do well on the check up (G-TELP) test. 3.32 3.67 3.38
82   I think it is important to achieve the highest possible grade. 4.20 4.43 4.13
Less Preferred Conditions (General mean scores lower than 2.8)
77   I plan to take a STEP®/TOEIC®/TOEFL® test soon. 2.73 2.69 2.64
79   I prefer essay tests to multiple-choice examinations. 3.05 2.91 2.39

[ p. 12 ]

4.3 Teachers' perceptions of their students' English learning and teaching styles

Items 21 to 36 of the teachers' questionnaire pertained to their perceptions of students' preferred English learning and styles and beliefs about what students expect of teachers. Table 3 summarizes the descriptive statistics for each question.

Notice how items 23, 26, 31, and 33 have high mean scores for both groups. Both Japanese and native English teachers agreed with students about many basic learning factors. Though there were slight differences of opinions about the use of translation exercises or using Japanese in class, the only statistically significant difference concerned attitudes towards video or TV use while teaching: Japanese teachers were significantly more positive about using this technology in class than native English speaking teachers were.


Table 3. Teachers' perceptions of students' preferred English learning/teaching styles.

Survey
Item #
Statement Japanese EFL Teachers
Mean / (SD)
Native EFL Teachers
Mean / (SD)
21   Ss do not like to express themselves. 3.33 / (1.24) 3.24 / (1.25)
22   Ss do not like to talk freely in class. 3.33 / (1.08) 3.24 / (1.30)
23   Ss learn when the class is fun. 3.83 / (0.79) 3.82 / (1.42)
24   Using Japanese for explanations is okay. 3.67 / (0.97) 3.06 / (1.30)
25   Ss prefer same gender pair/group work. 2.28 / (0.96) 2.35 / (1.27)
26   Ss like pair/group work. 3.50 / (1.04) 4.12 / (1.54)
27   Ss prefer strict teachers. 3.00 / (0.77) 3.00 / (1.27)
28   Ss like tests and homework. 3.39 / (0.70) 3.18 / (1.13)
29   Ss want immediate error correction. 3.17 / (1.10) 2.76 / (1.35)
30   Ss like learning grammar. 3.50 / (0.99) 2.76 / (1.39)
31   Ss like being helped individually in class. 3.61 / (0.98) 4.12 / (1.11)
32   Ss like translation exercises. 2.89 / (1.28) 2.24 / (1.15)
33   Ss prefer finding their own answers. 3.53 / (0.80) 3.69 / (1.25)
34   Ss prefer correct their own work. 3.17 / (0.92) 3.29 / (1.26)
35   Ss like using video/TV in class. 3.78 / (0.81) 2.82 / (1.33)
36   It is good to assign Hw using radio/newspaper. 3.06 / (1.06) 2.71 / (1.16)


4.4 Teachers' attitudes toward assessment/evaluation


Items 15 to 20 of the teachers' questionnaire concern their attitudes toward assessment / evaluation. Table 4 summarizes the descriptive statistics for those questions. Only Item 16 showed a mean higher than 3.5 among both Japanese and native English teachers. On the contrary, item 17 showed a mean lower than 2.5 for each teacher group. Both groups view class participation as an important facet of learning. Item 18 had a mean 3.5 above for each teacher group. Like students, teachers also preferred short quizzes to single large exams for evaluation.

[ p. 13 ]


Table 4. Teachers' views on evaluation/assessment

Survey
Item #
Statement Japanese EFL Teachers
Mean / (SD)
Native EFL Teachers
Mean / (SD)
15   Semester-final tests motivate Ss. 3.33 / (0.97) 2.94 / (1.14)
16   Class participation is important in grading. 3.67 / (0.97) 2.94 / (1.25)
17   Ss should participate in the grading process. 1.94 / (0.87 2.94 / (1.25)
18   Prefer giving short quizzes to final tests. 3.61 / (1.04) 3.35 / (1.46)
19   Use 4 skills for grades on transcripts. 3.28 / (0.89) 2.53 / (1.23)
20   Eng. proficiency test skill courses should be offered. 3.59 / (0.94) 3.00 / (1.32)


4.5 How students in different classes varied

Among those 434 students who participated in this study, 70 students were placed into advanced level classes after scoring 80% or higher on the G-TELP (Level 4) Examination in April. 221 of the students were placed into intermediate-level lasses after obtaining scores between 60% and 79% on the same examination. 143 were placed into basic-level classes after obtaining scores below 60% on this examination. Tables 5 and 6 show how these three student groups varied in terms of their preferred learning styles and expectations of teachers and attitudes towards assessment. Although there are small differences among each group, only one finding was actually statistically significant. Basic level students showed a clear preference for Japanese teachers when compared with advanced students. Other findings such as a greater willingness among advanced students to speak English in class or read newspapers for homework than basic students were indicative, but not statistically significant. Views about testing and assessment did not vary widely among students in the various class levels.

[ p. 14 ]

Table 5. Differences among student populations concerning learning and preferred teaching styles

Survey
Item #
Statement Mean (SD)
[Adv]
Mean (SD)
[Int]
Mean (SD)
[Bas]
1   I learn best in pair/group work. 3.95 / (1.10) 3.85 / (1.14) 3.32 / (1.26)
2   I learn best when working alone. 3.07 / (1.01) 3.11 / (1.14) 3.17 / (1.07)
3   I learn best with strict teaching. 2.66 / (1.09) 2.56 / (1.07) 2.47 / (1.13)
4   I learn best when following textbooks closely. 3.08 / (1.14) 3.33 / (1.14) 3.56 / (1.03)
5   I learn best with many tests and much homework. 3.30 / (1.18) 3.18 / (1.14) 3.07 / (1.20)
6   I learn best with Japanese explanations. 2.68 / (1.19) 3.34 / (1.23) 3.71 / (1.18)
7   I learn best with immediate error correction. 4.12 / (0.91) 3.89 / (1.02) 3.72 / (0.95)
8   I learn best with AV materials in language labs. 3.18 / (1.30) 3.15 / (1.22) 3.38 / (1.23)
9   I like to study grammar. 3.07 / (1.16) 3.17 / (1.23) 3.09 / (1.10)
10   I like when Ts help us individually in class. 3.65 / (1.02) 3.63 / (1.04) 3.38 / (1.01)
11   I like translation exercises. 3.63 / (1.07) 3.86 / (0.91) 3.71 / (0.98)
12   I like to choose my own group partners. 2.93 / (1.09) 3.35 / (1.07) 3.52 / (1.08)
13   I like to see words rather than hearing them. 3.78 / (0.94) 3.85 / (0.91) 3.70 / (0.98)
14   I like to try guessing answers. 3.28 / (1.04) 3.25 / (1.06) 2.98 / (1.06)
15   I prefer Japanese EFL teachers over native EFL teachers. 2.32 / (1.07) 2.89 / (1.05) 3.13 / (1.01)
16   I prefer to find out answers on my own. 4.03 / (0.97) 3.93 / (0.98) 3.55 / (0.99)
17   Having a friendly class atmosphere is important. 3.90 / (1.16) 3.77 / (1.11) 3.55 v(1.10)
18   I prefer to correct my own work. 3.38 / (0.94) 3.13 / (0.89) 2.90 / (0.89)
19   I like using video/TV in class. 3.35 / (1.29) 3.48 / (1.11) 2.90 / (0.89)
20   I like practice English outside of class. 3.63 / (1.15) 3.44 / (1.12) 2.96 / (1.08)
21   I like peer correction on writing work. 3.58 / (1.14) 3.44 / (1.07) 3.17 / (0.93)
22   I like to learn in classes that are fun. 4.48 / (0.91) 4.33 / (0.89) 3.93 / (1.11)
23   I like homework using radio/newspaper. 3.28 / (1.20) 2.97 / (1.15) 2.74 / (1.13)
24   I like talking with classmates in English. 3.37 / (1.24) 3.19 / (1.12) 2.80 / (1.10)
25   I like choosing class work on my own. 4.03 / (1.04) 4.17 / (0.94) 3.94 / (1.14)
26   I prefer working in same gender pairs/groups. 3.40 / (0.92) 3.45 / (0.93) 3.41 / (0.91)
27   I like learning English as in high school. 3.40 / (0.92) 3.45 / (0.93) 3.41 / (0.91)
28   I like studying in language labs / library. 2.92 / (1.37) 2.66 / (1.24) 2.80 / (1.34)

Table 6. Differences among student populations concerning assessment/evaluation

Survey
Item #
Statement Mean
(Adv)
Mean
(Int)
Mean
(Bas)
73   I prefer short quizzes to term tests. 3.78 / (1.02) 3.78 / (1.16) 3.74 / (1.19)
74   I do better on grammar tests than on tests of communication. 2.90 / (1.28) 3.18 / (1.22) 3.12 / (1.05)
75   I want to learn test taking strategies. 3.54 / (1.13) 3.93 / (1.11) 3.94 / (1.10)
76   I prefer computer-based tests. 2.63 / (1.08) 2.85 / (1.18) 2.90 / (1.12)
77   I prefer Essay tests. 2.73 / (1.11) 2.69 / (1.10) 2.64 / (1.13)
78   I prefer annual oral tests 3.36 / (1.17) 3.15 / (1.18) 2.69 / (1.18)
79   I plan to take an English proficiency test soon. 3.05 / (1.64) 2.91 / (1.38) 2.39 / (1.27)
80   I want to learn how to improve my G-TELP score. 3.32 / (1.46) 3.67 / (1.25) 3.38 / (1.23)
81   I concerned about failing grades. 3.25 / (1.39) 3.45 / (1.38) 3.56 / (1.34)
82   I want to achieve the highest possible grades. 4.20 / (1.22) 4.43 / (0.95) 4.13 / (1.17)

[ p. 15 ]

5. Discussion and Conclusion

Based on a careful examination of Tables 1-4, some generalizations concerning learner needs at the NUM program can now be attempted. Six items that showed a mean of 3.5 or higher by all three populations used in this survey are listed in Table 7.

Table 7. Major points of agreement between students and teachers in terms of preferred learning/teaching styles.

  • Both students and teachers think students learn best when teachers use fun activities. [Items #22 and #25 in SQ and #23 in TQ]
  • Both students and teachers agree that students learn best when teachers let students discover answers. [Item #16 in SQ and #33 in TQ]
  • Both students and teachers like to use pair work and group work in class. [Item #1 in SQ and #26 in TQ]
  • Both students and teachers think that students learn best when teachers move around the class and help individual students. [Item #10 in SQ and #31 in TQ]
  • Both students and teachers prefer a series of small quizzes to one large test in evaluation. [Item #73 in SQ and #18 in TQ]
  • Both students and teachers like the idea of teaching test taking skills. [Items #75 and #80 in SQ and #20 in TQ]

The results presented here suggest that teachers and students see eye-to-eye about many teaching issues. However, it is important to note there are also significant contrasts. Table 8 lists some of the main points of variance between teachers and students.


Table 8. Major points of disagreement between students and teachers in terms of preferred learning/teaching styles
  • While many students perceives that they learn best when they have translation exercises, some teachers (especially native English teachers) do not think that it helps them improve their English proficiency. [Item #11 in SQ and #32 in TQ]
  • While many students like to work in same sex groups, teachers do not think that they learn most effectively when working in same-sex groups. [Item #26 in SQ and #26 in TQ]


Based on an analysis of the different responses among learners in the advanced-level, intermediate level, and basic-level language classes, only one marked difference in preferences came out: basic level students clearly prefer Japanese teachers over native English speaking teachers.

For further research, it would be good to use more studies using multiple methods and sources of information about student/teacher attitudes. Future studies should include both qualitative interviews and direct observations of learners.

Despite its limitations, this is one of the few studies which have analyzed English language learning needs by comparing students' views with the views of both Japanese and native English teachers. This study has shown some of the ways that different proficiency level learners tend to differ in assessing their language learning needs.

[ p. 16 ]

References

Brown, J. D. (1995). The elements of a language curriculum. Boston: Heinle & Heinle.

Busch, M., Elsea, M., Gruba, P., & Johnson, F. (1992). A study of the needs, preferences and attitudes concerning the learning and teaching English proficiency as expressed by students and teachers at Kanda University. The Journal of Kanda University of International Studies, 6, 174-235.

Hayasaka, K. (1995). An EFL needs analysis of the students of Hokusei Gakuen University. Hokusei Review: Journal of the Faculty of Literature of Hokusei Gakuen University, 32, 67-91.

Kikuchi, K. (2001). Analysis of the listening needs for EFL learners in a Japanese college. Unpublished master thesis. Honolulu: University of Hawai'i at Manoa.

Kumazawa, T. (2003). A subjective needs analysis pilot study. Annual review of the Ibaraki University Center for Research and Development in Higher Education, 7, 29-39.

Kusanagi, Y. & Kumazawa, T. (2004). A pilot needs analysis of Rikkyo University Freshman. The Journal of Rikkyo University Language Center, 9, 47-79.

Kuwabara, H., Nakanishi, T. & Komai, K. (2005). Needs analysis of the general English classes. Studies in Communications: Bulletin of the Faculty of Humanities of Ibaraki University, 14, 27-54.

Long, M. H. (1999). Methodological issues in learner needs analysis. In Long, M. H. Second language needs analysis. Cambridge, England: Cambridge University Press.

Nishihori, Y. (1994). An investigation of English language education at university level: Questionnaire survey given to 300 senior students of 12 universities. Language and culture: A publication of Hokkaido University, 25, 97-137.

Richards, J. (2001). Curriculum development in language teaching. Cambridge: Cambridge University Press.

Tachiki, D., Ogane, E., & Perttila, T. (2002). English for communication: A needs analysis of the EC program at Tamagawa University. Ronso: Journal of Tamagawa University, Faculty of Business Administration, 2, 163-174.

West, R. (1994). Needs analysis in language teaching. Language Teaching, 27 (1), 1-19.

Witkin, B. R., & Altschuld, J. W. (1995). Planning and conducting needs assessments: A Practical guide. London: SAGE.

Yonesaka, S. (1994). An analysis of first-year students' perception of their EFL needs. Studies in Culture, 2, 87-121.

Main Article Appendix 1 Appendix 2

Newsletter: Topic IndexAuthor IndexTitle IndexDate Index
Main Page Background Links Network Join
last Main Page next
HTML: http://jalt.org/test/kik_1.htm   /   PDF: http://jalt.org/test/PDF/Kikuchi1.pdf

[ p. 17 ]