JALT Testing & Evaluation SIG Newsletter
Vol. 14 No. 2. October 2010. (p. 11 - 18) [ISSN 1881-5537]
PDF PDF Version


Equating classroom pre and post tests under item response theory

Jeffrey Stewart and Aaron Gibson (Kyushu Sangyo University)

Abstract
The authors illustrate how classroom pre-tests can be used to gather information for an item bank from which to construct summative post-tests of appropriate levels and measurement properties, and detail methods for equating pre and post-test forms under item response theory in such a manner that resulting ability estimates between conditions are comparable.

Keywords: Item Response Theory, test equating, classroom assessment


Norm referenced tests, which rank individuals relative to other test takers, have long had a place in standardized testing and competitive processes (Westrick, 2004). The aim of entrance exams is often to select the most proficient candidates for a position available, regardless of the overall ability of the group of candidates as a whole. As a consequence, even test takers of relatively high ability will perform poorly on such a test if their score is low relative to other test takers. However, in a classroom setting, we wish to construct criterion referenced tests (Brown & Hudson, 2002), which evaluate students' knowledge on a fixed subject matter. In such a test, it is not only possible but desirable for all students to receive high scores. In some contexts, such as a test for a pilots' license, extremely strict and detailed criteria are used to determine pass/fail rates. In other cases, benchmarks and expectations for content mastery are set at given levels.
However, establishing appropriate criteria can be challenging in language learning programs. Language study can be a lifelong endeavor, requiring years of study from even the most motivated and hard working of students. In such contexts, if course hours are limited, we may wish to evaluate student improvement throughout the course. In others, we may wish to pilot a curriculum and establish benchmarks for ourselves as educators as to what levels of progress are attainable or reasonable to expect within available contact hours. For example, if university level Japanese ESL students study an academic wordlist over a year with 45 contact hours and 30 hours of homework, what gains can we expect to see? Ipsative testing, which assesses learners by prior performance, can assist educators in setting standards when such questions arise.
Such concerns can be addressed by pre and post-tests, as detailed by Brown (2005). In its simplest form, this can consist of giving students identical or parallel forms on the first and last days of classes. Testing students both before and after instruction can help us determine how much students have progressed in ability. However, this approach has limitations. If items or sections of a pre-test prove to have been problematic upon analysis, we are left with few principled methods for adjusting them prior to the course's post-test under classical test theory. Since the score of the test is determined by the total number of items correctly answered, there are restrictions on the degree to which we can edit such a test for a post-test form and still retain useful comparisons to the pre-test condition; items that perform poorly due to poor wording or ambiguous distractors can be difficult to remove without affecting score interpretations. And if scores on a pre-test are high, the post-test will be left with little room to measure change, as the majority of items will serve no purpose. Of course, over time, parallel forms can be developed from which meaningful comparisons can be made, but this can process can take several cycles of test administrations to perfect, and unfortunately, measuring changes between pre and post conditions can be of great importance in early phases of a curriculum, before equivalent forms have been developed
Numerous methods exist for equating alternate forms of tests, but many are inappropriate for comparing pre and post forms. For example, forms of equipercentile equating, a common non-IRT equating method (Livingston, 2004), equate test forms by comparing the raw scores of forms by percentile ranks. For example, if test takers must receive a raw score of 80 to reach the 99th percentile on form A, but a score of 84 to reach the 99th percentile on form B, scores of 80 and 84 are considered to be equivalent.

[ p. 11 ]

While this equating method is appropriate for norm-referenced tests, where the aim is to rank test takers in reference to one another, it is not appropriate for equating pre and post conditions. Suppose a class improves on average over the course of a school year. In most cases scores on the post-test condition will be almost uniformly higher. A higher score will then be required to reach the highest percentile on the post-test form, and students will simply be re-ranked on a new curve, without reference to improvement from the pre-test condition. For example, a low level student who sees tremendous gains between conditions may still receive a relatively low percentile rank relative to his or her classmates on the post test.
Item response theory offers an alternative to traditional equating methods. Under this framework, estimates of ability are invariant across the subsets of items that constitute various test forms. Therefore (allowing for measurement error), if item parameters have been estimated, two test takers who take two different test forms can be plotted on a single, common scale of ability, even if the test forms vary in difficulty (Hambleton, 1989).
This paper details steps for analyzing pre-test results and using the data to build post-tests with optimal measurement properties under IRT. It should be stressed that the test design described is most appropriate for evaluation of new curricula, and establishing expectations for gains on covered material. The design is also useful for educators conducting research on forms of instruction, who wish to measure changes in ability between pre and post conditions with as much accuracy as possible. Ultimately, once benchmarks are established based on improvement by cohorts in previous years, it is preferable to base item estimates on past post-test results as ability distributions between conditions may differ (Hambleton, Swaminathan & Rogers, 1991). But for new curriculums and lower stake classroom assessments, such methods can allow us to use the information we extract from pre-tests to help us to track gains throughout a course, and build theoretically sounder post-tests.

Procedure

The following paper details a procedure for administering pre-test forms, building an item bank, selecting items for post-tests, and finally equating pre-test and post-test conditions using Winsteps (Linacre, 2010a), an inexpensive and user friendly software program for analysis of test data under the Rasch model. A full discussion of differences between the 1-parameter Rasch model and 2 and 3 parameter logistic models is beyond the scope of this paper, though it should be noted that ability estimates between these models are typically very highly correlated (Fan, 1998). And in practice, it is the authors' experience that if items are well constructed, ability estimates between models rarely vary enough to warrant sacrificing the advantages of the Rasch model, such as the smaller minimum sample sizes required for parameter estimation (100). Winsteps' extensive user manual (Linacre, 2010b), available at http://www.winsteps.com/a/winsteps.pdf, should be referred to in tandem with this paper. The paper concludes with recommendations for the interpretation of scores. Procedures for assembling and equating pre-tests and post-tests are outlined in Figure 1.

Figure 1
Figure 1. A suggested procedure for a course testing cycle

[ p. 12 ]

Step 1: Create a variable map

Too often, test makers only select items with concern for their usefulness in discriminating between test takers, and with little concern for underlying theory regarding what should be taught or why. As Bachman noted in a past SHIKEN interview (Hubbell, 2003, p. 13), test validity, rather than statistical concerns, poses the greatest challenge to test makers. We may not yet know our students' current level of ability, but we can form theories regarding the steps involved in teaching the material and hypothesize stages in which to deliver instruction. For example, we may theorize that knowledge of content-related vocabulary is a necessary (though not sufficient) condition for comprehension of reading passages, and that therefore, gains on tests of reading comprehension will not be observed until after mastery has been attained on the necessary vocabulary. To aid in this hypothesis testing, we recommend creating what is known as a variable map, which plots items by hypothesized difficulty. If this is done, we can gain insights not only into what stages of our subject our students have mastered and have yet to master, but also into our own conceptions of our curriculum, to see if the tasks are ordered by difficulty in the manner we expect them to be.
Of course, it is unlikely that all tasks or items of a given type will be of precisely identical difficulty. However, under observation, items of given types may form clusters with average difficulties that meaningfully differ from those of neighboring task types. For example, vocabulary test items in the example above may not be of equivalent difficulty, but on average, vocabulary items may be found to cluster below items testing reading comprehension.

Step 2: Construct pre-test items

One must anticipate that all piloted items may not be usable, and that therefore, a larger number of items should be pre-tested than are intended to be used on post-tests. If the material is new to educators, in some cases even the lower level students may attain relatively high scores on pre-tests. In other cases, some item types may be so difficult that their mastery may be determined to be an unrealistic goal for the period of instruction. Finally, some items may not function well due to poor distractors, or ambiguously worded questions, and may have to be removed from the item bank that will be used for post-tests. For this reason, we recommend that as many items as possible be piloted.

Step 3: Create and spiral linked forms

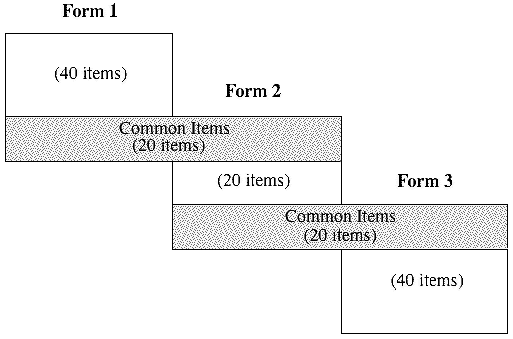
Piloting large numbers of items can pose difficulties. We do not wish to burden our students with endless pre-tests. How can we test more items in a limited time frame? A solution to this is to administer different forms to different students. An added bonus of this approach is that it assures that no one student will see all items. Forms can be equated under item response theory, which can easily be done using Winsteps. To do this, we construct a number of tests linked by common items, as illustrated in Figure 2.

Figure 2
Figure 2. Example of a test linking structure for 3 test forms

[ p. 13 ]

A spread of difficulty is important when choosing common items between forms, but it is difficult to ensure this if item parameters have not been previously estimated. One way to compensate for this weakness of design is by test spiraling. Rather than giving different forms to different classes, shuffle tests so that roughly equal proportions of students take each form in each class. In this manner, a student may write a somewhat different test from his or her neighbors. Randomly distributing forms among the student population can help ensure that the groups that write each form are of comparable ability.

Step 4: Equate Data in Winsteps

The pre-test forms can then be combined in a spreadsheet to form a large, single test. Though no student has written all of the piloted items, common items between tests link them. Winsteps handles missing data well, and will return estimates of person ability despite this. Please refer to the Winsteps instruction manual for further details.

Step 5: Select items and assemble post-test forms

The Rasch model provides estimates for person ability and item difficulty on a common scale. With this information, we can construct post-tests of appropriate difficulty for our students. The table below expresses the probabilities of successful endorsement of items given the logit difference between person ability and item difficulty.

Table 1. Logit to Probability Conversion Table

Logit Difference Probability of Success Logit Difference Probability of Success
5.0 99% -5.0 1%
4.6 99% -4.6 1%
4.0 98% -4.0 2%
3.0 95% -3.0 5%
2.2 90% -2.2 10%
2.0 88% -2.0 12%
1.4 80% -1.4 20%
1.1 75% -1.1 25%
1.0 73% -1.0 27%
0.8 70% -0.8 30%
0.5 62% -0.5 38%
0.4 60% -0.4 40%
0.2 55% -0.2 45%
0.1 52% -0.1 48%
0.0 50% -0.0 50%

As can be seen from the table above, if the logit difference between students and item is 0, the student has a 50% probability of correctly answering the question. Since raw score is a sufficient statistic for ability level under the Rasch model provided measurement requirements are met, we can therefore infer by extension that if a student of a logit ability of 1 writes a test of 100 items of 1 logit difficulty, the resulting raw score will be approximately 50/100. Since we already estimated person and item measures in the pre-test condition, we can now use the information in the above table to construct a post-test for which we can predict the raw score a student who had not seen any gain in ability would receive, before the test has been taken. For a new curriculum's post-test, we recommend selecting items of equivalent difficulty to the tested group's original ability level. This will result in a mean score of 50% if students do not improve in ability at all throughout the period of instruction.
Practitioners of Rasch measurement typically create tests with items of varying difficulties, to create a "pathway" along a hypothesized latent trait. In this instance however, we wish to focus on a relatively narrow point on this pathway, and make a test with a test information function (TIF) that provides as much information as possible at learners' prior level of ability, in order to measure progress beyond this point as accurately as possible. Targeting items to the tested population

[ p. 14 ]

increases reliability (Linacre, 2010b), and this design will provide maximum test information for departure from pre-test benchmarks. A pitfall of this approach is that the test will produce less reliable ability estimates for learners who far exceed original levels. Once expectations for development have been established, tests can be made that provide maximum information at the level of ability that students are expected to arrive at after instruction.
A benchmark of 50% may not seem to have a place in a classroom test. After all, items designed to produce mean scores of 50% are a hallmark of norm-referenced testing, as this threshold is optimal for separating learners by ability statistically. While ideal statistically, items of this difficulty may be demoralizing to students. At this point, however, we would like to stress that scores of 50% should only be anticipated for students who have not improved throughout the period of instruction, in other words, students for whom lower grades are appropriate.
Although we may wish for maximum test information at a given level, for practical reasons it is often not possible for all items to be of a precise, identical difficulty. Items may simply follow a normal distribution of difficulty surrounding the desired mean. This can be calculated by trial and error using a spreadsheet program such as Microsoft Excel. Simple formulas (e.g =AVERAGE(A1:A40)) can be used to calculate the logit mean of selected cells. We recommend sorting items by ascending logit difficulty, choosing an item of the precise desired difficulty as the first item, and gradually adding equal numbers of incrementally more and less difficult items in order to obtain an average that is close to the target set by the original item. A histogram of item measures can be used to check for near-normality.
Tertiary institutions in Japan are ranked by standardized rank scores to such a degree that students at a given institution are often strikingly homogenous in ability. For this reason, the authors find that a post-test centered to the mean of the groups' pre-test ability is often adequate for fair assessment of individuals' growth from the pre-test estimates of ability. However, if groups of students vary greatly in ability, a post-test centered in prior mean ability may not be appropriate for all test takers, as the maximum test information may then be located well above or below the ability level of groups of students at the tails of the distribution. For this reason, it may be appropriate to artificially divide students into level groups when grading, using the pre-test scores. Schools that conduct a placement test for classroom streaming are unlikely to need this procedure.
Step 6: Equate pre and post-test forms

The pre and post-tests must be equated before meaningful comparisons can be made between their scores. We wish to compare ability estimates on post-tests with ability estimates from pre-tests, and therefore, the post-tests should be examined with reference to pre-test information. This can be done by anchoring the items on the post-test with values derived from the pre-test condition using the command IAFILE= in Winsteps. The pre and post-tests will then share the same probabilistic structure, and logit estimations of ability between the two sets of tests will be directly comparable. Please refer to section 13.43 of the Winsteps manual for details.
If teachers wish to estimate and interpret test scores individually, it is also possible to estimate students' new levels of ability in logits from raw scores on the post-tests, without running another Winsteps analysis. Using the following formula (Wright, 1977), we can infer student ability measured in logits from the raw score on the test:

Person ability = Mean item difficulty + sqrt ( 1 + S.D. of item difficulty2 / 2.89)
*Log_e(right answer count / wrong answer count)

This formula can be entered in Microsoft Excel as:

= Average Difficulty+SQRT(1+(S.D of Difficulty^2)/2.89)*LN(Score/(k-Score))

[ p. 15 ]

Where "Score" indicates the cell containing a student's raw score, and k is the total number of items on the test.
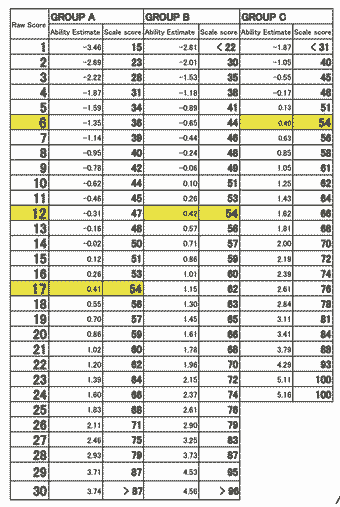
In the example below, there are tests for three levels of proficiency. The tests are "vertically scaled," linking forms of intentionally varying difficulty to a common scale. On Form 1 (Group A), used for the lowest level classes, a raw score of 16 is equivalent to a logit level of 0.26 using the above formula. However, for our mid level class using Form 2 (Group B), a raw score of only 11 is equivalent to an ability level of 0.26 logits. The accuracy of these estimates can be tested by giving a sample class two test versions, to confirm that the raw scores on the two tests return the same logit estimates.

Table 2. Raw score to logit conversion chart for three vertically scaled test forms
Table 2

Interpretation of Scores


If desired, differences between a learner's new ability estimates and the mean difficulty of the test can be converted to probabilities listed in Table 1. If the test takers' newly estimated ability is 1.4 logits or higher than that of the mean difficulty of the test, the test taker has an 80% probability of correctly answering an item of mean difficulty, and can be said to have attained mastery of that test's content. However, the value of changes in ability between pre and post-tests can be highly context dependent. We leave these judgments in the hands of teachers, offering four general suggestions for score interpretations:

Recommendation 1: Use the results of your post-test to evaluate not just the success of your students, but of your own teaching and curriculum

Examination of changes in difficulty for different types of items can give valuable information regarding successful and lacking aspects of the curriculum. Output Table 14 in the Winsteps program displays displacement values, which indicate how item measures on the post-test would have varied had they not been anchored with pre-test estimates of difficulty. Under normal circumstances, we wish for displacement values to be as small as possible for anchored items. Typically, half the displacements will be negative and half positive, distributed according to the standard errors of the measures. In a post-test condition however, we anticipate negative displacement values, as the items will have become easier for students to answer due to instruction.

[ p. 16 ]


Displacement values can indicate the relative success of instruction for different components of the curriculum. Suppose items 1-10 on the post-test concern phonics, and the mean displacement value is sizeable. This indicates progress in this area. Conversely, another test section may see smaller displacements, calling for changes in the treatment of this content area during instruction.

Recommendation 2: Distinguish between specific criteria and measures of general proficiency when interpreting scores

If a specific criterion is taught (for example, knowledge of a word list), students may see considerable gains from the pre-test condition. But even if instruction is relatively effective, gains may be smaller for tests of improvements on more general measures (for example, "reading comprehension"), particularly if hours of instruction are limited. Some institutions give standardized tests such as the TOEFL® and TOEIC® after each semester, expecting large gains, but research has shown that hundreds of hours of study are required to see large, meaningful gains on such tests of general proficiency (e.g. Swinton, 1983). Consequently, even effective instruction can produce seemingly negligible results if contact hours are limited. If feasible, educators may wish to give criteria-specific tests for evaluation, and tests of general proficiency to determine the overall effect of instruction.

Recommendation 3: Focus on changes in logit measures, not raw scores

As Table 2 made clear, tests that result in quite different raw scores can return identical estimates of ability, and tests that return different estimations of ability can do so with differing raw scores. For this reason, it is important to base score interpretation on logit estimates, rather than the raw scores that produce them. While highly correlated to logit estimates, raw scores are not additive; the difference between a score of 15 and 16 on a test my not be equal to the difference between scores of 29 and 30.

Recommendation 4: Resist the temptation to rank students' performance ordinally, even if the test's reliability makes it easy to do

Tests that have not been targeted to match a group's mean ability can report similar scores for all test takers. For example, students may score an average of 85%, with a small standard deviation and few scores markedly higher or lower. In such cases, we simply accept that most students appear to vary little in ability. This can give a sense of reassurance that there are not disparities in ability between students.
Optimally, tests make use of the available range of scores, even if the tested population is relatively homogenous in ability. Examining tests that have been carefully targeted to the intended population for the first time can be surprising, because they can frequently produce greater variation in scores than is typically seen in poorly made or untargeted tests. It becomes easier than ever to separate and rank students by ability. However, differences in raw scores do not necessarily signal important disparities in ability. These more accurate tests are analogous to a magnifying glass placed on your students' ability: just because the distances between abilities are now easier to see from raw score does not mean that the distances have become larger. When inspecting logit estimates, it may be the case that all students have seen admirable gains and are relatively close in ability. For this reason, logit estimates of ability should take priority. And of course, above all, we recommend students be assessed by what they can do after a period of instruction, not what they can do relative to their peers.

Acknowledgement

* The authors extend special thanks to Dr. John Michael Linacre*

[ p. 17 ]

References

Brown, J. D. (2005). Testing in language programs: A comprehensive guide to English language assessment (New edition). New York: McGraw-Hill.

Brown, J. D., & Hudson, T. (2002). Criterion-referenced language testing. Cambridge University Press.

Fan, X. (1998). Item response theory and classical test theory: An empirical comparison of their item/person statistics. Educational and Psychological Measurement, 58, 357 - 381. DOI: 10.1177/0013164498058003001

Hambleton, R. K. (1989). Principles and selected applications of item response theory. In R. L. Linn (Ed.), Educational Measurement (3rd ed., pp. 147-200). New York: Macmillan.

Hambleton, R. K., Swaminathan, H., & Rogers, H. J. (1991). Fundamentals of item response theory. Newbury Park, CA: Sage Publications.

Hubbell, J. (2003). An interview with Lyle Bachman. SHIKEN, 7 (2), 12 - 15.

Kolen, M. J., & Brennan, R. L. (2004). Test equating, scaling and linking. (2nd ed.), New York: Springer.

Linacre, J. M. (2010a). Winsteps. (Ver. 3.64.0) [Computer Software]. Beaverton, Oregon: Winsteps.com.

Linacre, J. M. (2010b). A user's guide to Winsteps. Retrieved Jan 16, 2010 http://www.winsteps.com/a/winsteps.pdf

Livingston, S. A. (2004). Equating test scores (without IRT). Princeton, NJ: ETS. Retrieved August 28, 2010 from http://www.ets.org/Media/Research/pdf/LIVINGSTON.pdf

Swinton, S. S. (1983). TOEFL Research reports, Report 14. Princeton, N.J.: Educational Testing Service.

Westrick, P. (2004). Criterion-referenced language testing. Higher Education, 10, 71 - 75. Retrieved August 28, 2010 from http://rche.kyushu-u.ac.jp/education/paper1007.pdf

Wright, B. (1977) Solving measurement problems with the Rasch model. Journal of Educational Measurement, 14 (2), 97-116. DOI: 10.1111/j.1745-3984.1977.tb00031.x


Newsletter: Topic IndexAuthor IndexTitle IndexDate Index
TEVAL SIG: Main Page Background Links Join
last Main Page next
HTML: http://jalt.org/test/ste_gib1.htm   /   PDF: http://jalt.org/test/PDF/Stewart-Gibson1.pdf

[ p. 18 ]