ITesting the test: Using Rasch person scoresby H. P. L. Molloy (Toyo University Faculty of Business Administration) |
Abstract |
The results of analyzing a set of tests used for measuring classroom progress in EFL reading are reported.
Some 353 students in Japanese university English classes took one of four tests in 2008 and 2009. Student ability scores were derived using three analytic situations: all students together,
271 students from 2008 only, and 82 students from 2009 scored with items anchored at levels set the previous year. Student scores differed noticeably in the three analytic
situations, showing that item linking is necessary for intergroup comparisons. In other words, if you're not using the same tests, you cannot compare students. Keywords: language testing, Rasch measurement, test-score correlation, classroom testing, criterion-referenced testing, test-item linking |
[ p. 6 ]
We addressed this problem by counterbalancing the tests we developed over time and over students. We made four tests. Then, as a level-check exercise, gave a more-or-less randomly selected (see Molloy & Weaver, 2009a, 2009b) one-quarter of the students each of the tests. This allowed us to establish the difficulties of the items that made up the tests. We then anchored the item difficulties at the values determined during the first (level-check) administration for subsequent administrations, which allowed us fixed scales against which to measure student progress. We further worked against test content effects by having students take all of the tests in different orders at four different occasions during the semester, so that while one quarter of the students were taking one particular test on every testing occasion, the composition of those one-quarters of students was different at each test administration. Permuting 4 tests for administration order yields 24 unique orders of tests, and every class had, at most, two students taking the tests in any one particular order.[ p. 7 ]
Rasch analytic approaches yield "person-free item estimates" and "item-free person estimates." That is, items will be measured as equally difficult no matter what the ability of the people who respond to those items and people will be measured as equally able no matter which items they respond to. This may seem counterintuitive, but Rasch analysis of tests is based on the interplay of persons and items, essentially defining one in terms of the other.Table 1. Number of students who took each test on each occasion | ||||
---|---|---|---|---|
Occasion | Test A | Test B | Test C | Test D |
Fall 2008 | 70 | 65 | 67 | 69 |
Fall 2009 | 19 | 20 | 19 | 24 |
Total | 89 | 85 | 86 | 93 |
[ p. 8 ]
Hence, each test comprised two passages each from a popular science book written for proficient English users and questions about each of the passages. Each test also included one further book excerpt alongside a passage conveying the same information rewritten in a non-formal style (e.g., Eggins, 1994).[ p. 9 ]
Another kind of file ("Anchored") contained only responses from the second batch students (with ns like the "Fall 2009" row in Table 1) with the item difficulties anchored at the levels derived from the first test administration. This, again, was treating the tests as if they were made of items of perfectly known difficulty and simply measuring the Fall 2009 students against that difficulty scale.Table 2. Correlation coefficients for test scores under three testing situations for the same students | |||||||||
---|---|---|---|---|---|---|---|---|---|
Year 1-anchored | Year 1-new | Anchored-new | |||||||
r | ρ | τ | r | ρ | τ | r | ρ | τ | |
Class A (n=39) |
0.95 | 0.96 | 0.86 | 0.97 | 0.95 | 0.85 | 0.90 | 0.90 | 0.75 |
Class B (n=35) |
0.95 | 0.97 | 0.96 | 0.85 | 0.97 | 0.86 | 0.91 | 0.92 | 0.76 |
[ p. 10 ]
Score differences under each of the three testing situations appear in Table 3. This shows the mean difference in Winsteps ability scores for the students in each of the classes. We might consider higher scores to a difference of the placement of the ruler vis-à-vis some unknown "real" ruler's center. For the purposes of the Winsteps runs, persons were always centered at zero, so any differences seen in Table 3 can be attributed to a sample-dependent moving of the center of the ruler with relation to rulers derived from the other testing situations. Perhaps we might conceive of a hypothetic "real" ruler (perhaps created with and encompassing the abilities of all English-using readers) in relation to which the rulers in each of the testing situations is placed relatively high or low.Table 3. Average absolute deviations of Winsteps ability scores for each class under each combination of testing situations | |||
---|---|---|---|
Year 1-anchored | Year 1-new | Anchored-new | |
Class A (n=39) |
0.14 | 0.11 | 0.21 |
Class B (n=35) |
0.13 | 0.10 | 0.21 |
[ p. 11 ]
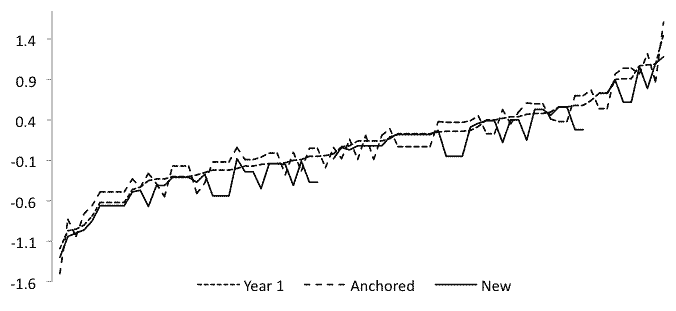
The information on deviations is sobering. The correlation coefficients show students are being ranked fairly consistently. However, we can see that, without some information linking groups of students, we cannot tell if, for example, the top student from one class (say, Mr. Suzuki) is more skilled than the top student (say, Ms. Takakusagi) from another class. What happened here was, even though different students were taking the same test, the context of the other students' responses being included in the test analyses affects their scores. If Mr. Suzuki scored, say, +1 when analyzed along with the other students in his class and Ms. Takakusagi a +0.56 with those in hers, we might still find that Ms. Takakusagi is ranked higher than Mr. Suzuki if scores from her class are analyzed with Mr. Suzuki's class'. Luckily, estimating item difficulties from one group of students and using those difficulties for other students allows us just such linking. Were I to give the test at another university, I would be happy to say the students at that university were better than, worse than, or just the same as students at my own. This I would say, however, only if I gave the same test to all the students and fixed item difficulty scores to those derived from one set of students. If I were giving separate tests to students in different universities, for example, I would not feel confident in ranking students from different groups. Note, however, that the tendency for scores to float about that is most clearly understandable from the curves in Figure 1 implies there is no "real" central ability score (and, because of the way Rasch analyses work, that there is no "real" average item difficulty). In Figure 1, the "Anchored" scores generally are higher than the other two test situations, meaning that the items were more difficult for the Fall 2008 students than for the Fall 2009 students. If the items were equally difficult for the students from both years, all three lines would fall in roughly the same spots. Again, because of the way Rasch analyses work to fit data to the Rasch model, we can assume item estimates for the three test situations will evince similarly situated sets of lines on a graph. This we will see in a subsequent report.[ p. 12 ]