Shiken: JALT Testing & Evaluation SIG Newsletter
Vol. 11. No. 1. March 2007. (p. 2 - 16) [ISSN 1881-5537]


Evaluating the construct validity of an EFL test for PhD candidates:
A quantitative analysis of two versions

Chinese title

by JIA Yujie (Chinese Academy of Sciences) & ZHANG Wenxia (Tsinghua University)

Abstract

Validity is a relatively well-researched topic in the study of language testing, attracting considerable attention by language test designers and researchers in recent decades. This study is dedicated to investigating the construct validity of an EFL test for Ph.D. candidates from a quantitative perspective. With two versions of the English entrance examination for doctoral candidates at an institution in China as a case study, a quantitative method is adopted to analyze how this test has changed over a nineteen year time span based on item analysis and correlation coefficients. This article concludes by considering the strengths and shortcomings of the more recent version of this test.

Keywords: construct validity, correlation coefficient, item analysis, quantitative method
Chinese abstract, and keywords


". . . the greater a test's social impact is, the higher its need for validity."
As an important test taken by about six thousand persons annually (Liu Bin, Chinese Academy of Sciences, January 23, 2007), the Chinese Academy of Sciences English Entrance Examination for Doctoral Candidates (CASEEEDC) has played an important role in deciding whether Ph.D. candidates can continue their studies since 1984. This placement test was designed to ascertain whether candidates have enough English skills to pursue doctoral research. Like any test, it should be reliable and valid for the purpose for which it is intended. The validity of a test is by far the most important criterion by which it should be measured (Yang & Weir, 1998, p. 55). Moreover, the greater a test's social impact is, the higher its need for validity. Despite the fact that the CASEEEDC has been implemented for over twenty years, few empirical studies have been conducted on it. Considering the substantial amount of washback this test generates, the need for validation studies seems all too evident. Among the three widely recognized types of validity – internal, external and construct validity – Alderson, Clapham & Wall (2000, p.172) consider construct validity to be the most difficult to understand and also the most important. Those authors also regard it as an umbrella term for the other two types of validity. In other words, it is a superordinate form of validity to which internal and external validity contribute.

A construct is defined in terms of a theory that specifies how it relates to other constructs and to observable performance (Bachman, 1990, p. 255). Ebel and Frisbie contend that:
Construct validation is the process of gathering evidence to support the contention that a given test indeed measures the psychological construct the makers intend it to measure. The goal is to determine the meaning of scores from the test, to assure that the scores mean what we expect them to mean (1991, p. 108).

[ p. 2 ]

One way of assessing the construct validity of a test is to correlate its different test components (Alderson, Clapham & Wall, 2000, pp. 183-184). Using quantitative methods, this paper focuses on correlated item analyses of the 1986 and 2005 versions of the CASEEEDC to see how it has changed.

Research questions

This paper explores two primary research questions:
  1. How do the 1986 and 2005 versions of the CASEEEDC differ?

    Sub-questions:
    *(i) How do the test item types, descriptive statistics, item facilities and item discriminations of the two versions differ?
    *(ii) How well do the 1986 and 2005 versions correlate?


  2. What are the strengths and shortcomings of the current version of this test?

    Sub-questions:
    (i) How well does the total score of the 2005 test correlate with every subtest?
    (ii) How well do the different subtests of the 2005 test correlate with each other?

Although this paper has a quantitative focus, it in no way discounts the value of qualitative and judgmental analyses. An examination of the CASEEEDC from those perspectives will appear in a subsequent paper.

Methodology

1. Participants

This study uses a 'common-person design' (Yang & Weir, 1998, pp.152-153) in which all examinees sat both tests under similar conditions with a minimal time between administrations. In this study, 66 students pursuing their master in science degrees in various disciplines at the Chinese Academy of Sciences took the 1986 and 2005 entrance exams in October 2006. There was one week interval between the test administrations.

The average age of the respondents was 23 and 80% were male and 20% were female. Most of the applicants in this sample intend to take the 2008 Chinese Academy of Sciences English Entrance Examination for Doctoral Candidates, so in that sense the survey sample was well indicative of the target population of examinees.

2. Materials

Two research instruments were used in the study: two paper-and-pencil tests and two questionnaires. Each will be briefly explained.

2.1 Tests

The 1986 and 2005 versions of the CASEEEDC test were selected for this study to gauge how much this test has changed over 19 years. The compositions of the two versions with the rubrics are provided in Tables 1 and 2. For a full version of each test, refer to Appendix A and Appendix B.

Tables 1 and 2 outline the basic structure of both versions. Structurally, the 2005 test varies from the 1986 test in five ways:
  1. The introduction of new 10-point listening and translation sections.
  2. The deletion of the former 25-point structure section.
  3. The reduction in weight of the cloze and writing sections.
  4. A reduction in the number of overall test items from 101 to 91.
  5. An increase in the overall test time from 130 minutes to 180 minutes.
  6. A reduction in the total score of the whole test from 120 to 100 points.

[ p. 3 ]

Table 1. A structural overview of the 1986 CASEEEDC test
Section Sub-Section Item types Points Item number (k) Time
I.
Structure
A MCQ 13 13 20
minutes
B MCQ 12 12
II.
Vocabulary
A MCQ 10 10 25
minutes
B MCQ 8 8
C blank filling 7 7
III.
Cloze
blank filling 20 20 20
minutes
IV.
Reading
MCQ 30 30 50
minutes
V.
Writing
extended essay 20 1 35
minutes
TOTAL:* 120 101 150
minutes

Table 2. A structural overview of the 2005 CASEEEDC test
Section Sub-Section Item types Points Item number (k) Time
I.
Listening
MCQ 20 20 20
minutes
II.
Vocabulary
MCQ 10 20 15
minutes
III.
Cloze
MCQ 15 15 15
minutes
IV.
Reading
MCQ 30 30 60
minutes
V.
Translation
Sentence level translations 10 5 30
minutes
VI.
Writing
extended essay 15 1 40
minutes
TOTAL:* 100 91 180
minutes

2.2. Questionnaires

Two questionnaire surveys were distributed after the tests. The first consisted of four participant profile questions and nine questions with a 5-point Likert scale that focused on the participants' perception of the individual sections of the test in terms of the facility level and other factors. A complete version of this Chinese questionnaire is in Appendix C.

The second questionnaire consisted of three parts. The first two parts were similar to the questionnaire in Appendix C, but the third part (Questions 12 to 13) asked participants to compare the 1986 version and the 2005 version of the CASEEEDC. This Chinese questionnaire appears in Appendix D.

3. Data collection

On October 30, 2006, the 1986 test was distributed to the respondents. The examinees were given 150 minutes to finish that test and five minutes to complete the questionnaire in Appendix C. One week later they received the 2005 test papers and they were given 180 minutes to finish the exam and 7 minutes to complete the questionnaire in Appendix D.

4. Data analysis

All the test scores and data from questionnaires were input into Excel® and SPSS® for computation and statistical analysis to see how these two versions of the test differed.

[ p. 4 ]

Results


The raw data from this study is in Appendix E, online at www.jalt.org.test/jz_1ApE.htm. Research findings from the statistical analysis are summarized in the following sections.

1. Comparison of descriptive statistics of the two versions

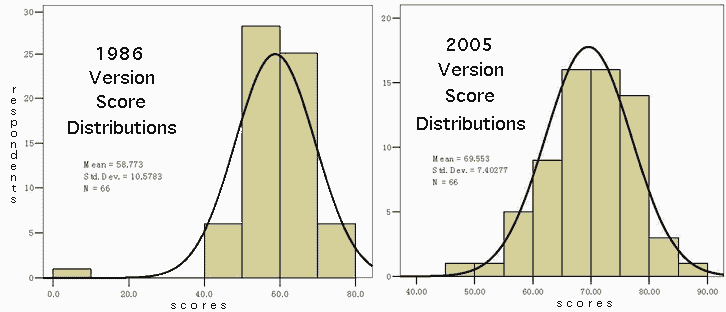
Table 3 compares the descriptive statistics for both tests. Those statistics suggest that the 2005 test was easier overall than the 1986 test. Moreover, the 2005 test had somewhat smaller standard variation, but over twice as much variance as the 1986 test. Though the majority of students performed within a fairly tight score band in the 2005 test, the 2005 test also had a greater range of overall score distributions.


Table 3. Descriptive statistics of the 1986 and 2005 CASEEEDC tests

1986 2005 1986 2005 1986 2005
Overall correct answer rate: 49% 69.6% Mode: 55.5 75.0 Standard Deviation: 10.58 7.40
High Score: 78.5% 85.5% Median: 59.0 70.5 Range: 34 points 37.5 points
Low Score: 44.5% 48.0% Mean: 58.8 69.6 Variance: 111.9 54.8


Figure 1 displays the total score distributions of the two tests graphically in terms of a histographic curve. The 1986 test had a much higher standard deviation and variance than 2005 test.

Figure 1

Figure 1. Frequency histograms of 1986 and 2005 CASEEEDC total test scores

[ p. 5 ]

2. Item facility and item discrimination

Sequentially, item discrimination and difficulty indices were employed. Item discrimination (ID) ascertains whether a test takers' performance shows uniformity across the examined items, and item difficulty or facility (IF) investigates the properties of individual test items' appropriateness for the target group's level (McNamara, 2000, p. 60). Items should be rejected if the IF is <.33 or >.67 (Henning, 2003, p. 49). To calculate the ID, first a High Group (HG) and Low Group (LG) must be established. As suggested by Brown (1995, pp. 43-44) it should be between 25% – 35% of the total group. For this study, 30% (n=20) was used. If the ID of an item was >.67, it was rejected as this is the lowest acceptable cut-off point (Henning, 2003. p. 52). All calculations are summarized in Tables 4 and 5.


Table 4. Acceptable items for the 1986 CASEEEDC test with this survey sample (n=66)
I. Structure
(25 items total)
II. Vocabulary
(25 items total)
III. Cloze
(20 items total)
IV. Reading
(30 items total)
V. Writing
(a single extended item)
Q11, Q12, Q25
(3 items acceptable)
Q43, Q46
(2 items acceptable)
Q58, Q60, Q63, Q65, Q66, Q68, Q69
(7 items acceptable)
Q93, Q94, Q96, Q98
(4 items acceptable)
(that item did not appear
to discriminate well)

Table 5. Acceptable items for the 2005 CASEEEDC test with this survey sample (n=66)
I. Listening
(20 items total)
II. Vocabulary
(20 items total)
III. Cloze
(15 items total)
IV. Reading
(30 items total)
V. Translation
(5 items total)
VI. Writing
(a single extended item)
(no acceptable items) Q35, Q39
(2 acceptable items)
Q41
(1 acceptable item)
(no acceptable items) (no acceptable items) (no acceptable items)


Tables 4 and 5 reveal that only 16% of the overall items from the 1986 test were acceptable and only 3.3% of those in the 2005 test were acceptable for this survey sample. This indicates that the CASEEEDC may need significant revision.

3. Correlations

As suggested by Alderson, Clapham & Wall (2000, pp.183-185) one way of assessing the construct validity of a test is to correlate its various test components with each other. These correlations are generally low – possibly in the order of +.3 – +.5. On the other hand, Alderson, Clapham & Wall suggest that in a well-designed test, the correlations between each subtest and the whole test can be expected to be higher – possibly around +.7 or more, since the overall score is taken to be a more general measure of language ability than each individual component score. Tables 6 and 7 list the various correlations for the 1986 test. Those with a single asterisk were statistically significant at the p<.05 level and those with double asterisks were significant at the p<.01 level.


Table 6. Correlation coefficients of the total score of the 1986 test with each subtest and the various subtests with each other
List wise Correlations
(n=66)
Total score I. Structure II. Vocabulary III. Cloze IV. Reading V. Writing
Total score Pearson Correlation 1 .387** .326** .522** .337** .339**
Sig. (2-tailed) .001 .008 .000 .006 .005
I. Structure Pearson Correlation .387** 1 .288* .293* .080 .217
Sig. (2-tailed) .001 .019 .017 .522 .080
II. Vocabulary Pearson Correlation .326** .288* 1 -.039 .176 .186
Sig. (2-tailed) .008 .019 .755 .157 .136
III. Cloze Pearson Correlation .522** .293* -.039 1 .088 .306*
Sig. (2-tailed) .000 .017 .755 .481 .012
IV. Reading Pearson Correlation .337** .0806 .176 .088 1 .093
Sig. (2-tailed) .006 .522 .157 .481 .455
V. Writing Pearson Correlation .339** .217 .186 .306 .093 1
Sig. (2-tailed) .005 .080 .136 .012 .455

** Correlation significant at the 0.01 level (2-tailed). * Correlation significant at the 0.05 level (2-tailed).

[ p. 6 ]

Table 7. Correlation coefficients of the total score of the 2005 test with each subtest and the various subtests with each other
List wise Correlations
(n=66)
Total Score I. Listening II. Vocabulary III. Cloze IV. Reading V. Translation VI. Writing
Total Score Pearson Correlation 1 .487** .535** .464** .627** .542** .548**
Sig. (2-tailed) .000 .000 .000 .000 .000 .000
I. Listening Pearson Correlation .487** -.073 .143 .293* -.026 .071 .430**
Sig. (2-tailed) .000 .561 .253 .839 .570 .000
II. Vocabulary Pearson Correlation .535** -.073 1 .027 .285* .341** .104
Sig. (2-tailed) .000 .561 .831 .021 .005 .405
III. Cloze Pearson Correlation .464** .143 .027 1 .039 .093 .293*
Sig. (2-tailed) .000 .253 .831 .756 .456 .017
IV. Reading Pearson Correlation .627(**) -.026 .285* .039 1 .281* .188
Sig. (2-tailed) .000 .839 .021 .756 .022 .131
V. Translation Pearson Correlation .542(**) .071 .341** .093 .281* 1 .097
Sig. (2-tailed) .000 .570 .005 .456 .022 .439
VI. Writing Pearson Correlation .548** .430** .104 .293* .188 .097 1
Sig. (2-tailed) .000 .000 .405 .017 .131 .439

** Correlation significant at the 0.01 level (2-tailed). * Correlation significant at the 0.05 level (2-tailed).

[ p. 7 ]

Correlations of both tests' corresponding sections are an effective way of comparing their constructs and seeing how consistent they are with each other. The correlations for the 1986 and 2005 tests are summarized in Table 8. The overall correlation coefficient was 0.316 (p<.05), suggesting only a moderate correlation between the two tests. According to Morgan, Griego & Gloeckner (2001, p. 82) the effect size was medium. The correlation of the 1986 and 2005 vocabulary sections was .167, but the p was 0.180 – which was considerably higher than .05. The correlation of the 1986 and 2005 cloze sections was .146, but this was not statistically significant (p=.243). The correlation of the 1986 and 2005 reading sections was .059, yet this too was not statistically significant (p=.638). The correlation of the writing parts of these two exams was the highest (.357) and it was statistically significant. Possible reasons for these figures will be discussed in the next section of this paper.

Table 8. Correlations of corresponding sections of the 1986 and 2005 tests
2005
Total score
2005
Vocabulary Section
2005
Cloze Section
2005
Reading Section
2005
Writing Section
1986
Total score
Pearson
Correlation
.316**
Sig.
(2-tailed)
.010
1986
Vocabulary Section
Pearson
Correlation
.167**
Sig.
(2-tailed)
.180
1986
Cloze Section
Pearson
Correlation
.146**
Sig.
(2-tailed)
.243
1986
Reading Section
Pearson
Correlation
.059**
Sig.
(2-tailed)
.638
1986
Writing Section
Pearson
Correlation
.357**
Sig.
(2-tailed)
.003
** Correlation significant at the 0.01 level (2-tailed).

4. Quantitative analysis of questionnaires

Now let us consider how the respondents felt about the two different tests by examining the questionnaires which were administered immediately after each test was completed. Respondents were given a 5-point Likert scale to answer 8 questions in the first questionnaire and 12 questions in the second questionnaire. The two questionnaires and raw data are in Appendix C and Appendix D.

Table 9. Survey responses for the 1986 CASEEEDC test
NOTE: 1 = "very easy" and 5 = "very difficult" for Qs 1-4;
1 = "strongly disagree" and 5 = "strongly agree" for Qs 5-9.
Survey Item Number of responses Mean Std. Deviation
Q1 How difficult was the Structure Section of this test? 62 3.31 .841
Q2 How difficult was the Vocabulary Section of this test? 62 3.71 .876
Q3 How difficult was the Cloze Section of this test? 62 3.52 .911
Q4 How difficult was the Reading Section of this test? 62 3.66 1.007
Q5 "The Structure Section reflects my English proficiency." 61 3.43 .991
Q6 "The Vocabulary Section reflects my English proficiency." 61 3.28 .985
Q7 "The Cloze Section reflects my English proficiency." 61 3.54 .886
Q8 "The Reading Section reflects my English proficiency." 61 3.62 1.051
Q8 "The Writing Section reflects my English proficiency." 61 3.70 1.025

[ p. 8 ]

Table 10. Survey responses for the 2005 CASEEEDC test
NOTE: 1 = "very easy" and 5 = "very difficult" for Qs 1-5;
1 = "strongly disagree" and 5 = "strongly agree" for Qs 6-11.
Survey Item Number of responses Mean Std. Deviation
Q1 How difficult was the Listening Section of this test? 66 2.77 .819
Q2 How difficult was the Vocabulary Section of this test? 66 3.62 .873
Q3 How difficult was the Cloze Section of this test? 66 3.38 .651
Q4 How difficult was the Reading Section of this test? 66 3.65 .774
Q5 "The Structure Section reflects my English proficiency." 65 3.31 .828
Q6 "The Listening Section reflects my English proficiency." 65 3.73 .833
Q7 "The Vocabulary Section reflects my English proficiency." 66 3.39 .926
Q8 "The Cloze Section reflects my English proficiency." 66 3.68 .844
Q9 "The Reading Section reflects my English proficiency." 66 3.71 .827
Q10 "The Translation Section reflects my English proficiency." 63 3.62 .831
Q10 "The Writing Section reflects my English proficiency." 65 3.63 .875


As for Question 12 in the second survey, about 63% (n=62 ) of the respondents felt that the 1986 test was more difficult than the 2005 test. Since the scores for the 2005 test tended to be higher than in the 1986 test, the quantitative data supports this. Interestingly, 79.3% (n=65) of the respondents felt that the 2005 test was more indicative of their English abilities than the 1986. A forthcoming paper employing qualitative methodologies will attempt to elucidate why.

Discussion and Conclusion

1. Main research findings

Three research findings were significant. The first research finding concerned differences of the test format, item facility, item discrimination and some descriptive statistics between the 1986 and 2005 tests. As for the response format and item types, it is fair to say that the 2005 test differed significantly from the 1986 test. The 1986 exam attempted to measure structure, vocabulary, cloze, reading and writing while the 2005 test purported to measure listening, vocabulary, cloze, reading, translation, and writing. Except for the translation and writing sections, all other sections of the 2005 test were in multiple-choice format. However, 1986 test's vocabulary part had a blank-filling section and the cloze part was entirely in the fill-in-the-blank format.

Tables 5 and 6 suggested that the 1986 and 2005 tests had many items which were performing poorly in terms of ID and IF. One possible reason for this was due to the response format. Whereas Section III and parts of Section II of the 1986 test had a fill-in-the-blank format, the first four sections of the 2005 exam were all in multiple-choice format.

The second research finding concerned the correlation between 1986 total score and its subtests. It is curious that reading part has the lowest correlation coefficient because in the 2005 examination this section had the highest correlation with the total score. This suggests that the topic of the reading passage may have an important role in shaping performance since the examinees draw upon their background knowledge when writing (Clapham, 1996). Also the text familiarity and task type may result in significant differences in subjects' overall and differential test and task performances (Salmani-Nodoushan, 2003). The 1986 test was about animals, the nature of science, and reflections on the past. It contained three passages with 10 questions per passage. The second passage was especially long (860 words). By contrast, the 2005 test was about personal experience, developing sense of trust, students' daily life, and radiation. There were five passages in 2005 test, each of which was 400-500 words. The topics for the 2005 test were probably more familiar to the examinee than the topics in the 1986 test. There were also great differences in the task type.

As suggested by Alderson, Calpham & Wall (2000, p.184) the correlations of subtests should be possibly in the order of +0.3 – +0.5. In the 1986 test only Sections I and II, I and III, and III and V had such correlations. This suggests that the 1986 test measured constructs which were quite separate and unrelated. The 2005 test had only four sections which correlated within the parameters suggested by Calpham & Wall. Sections II and V correlated moderately, as did as Sections I and VI. The fact that many of the sub-tests did not correlate should encourage to pause and reflect on what this test is actually measuring. The Writing Section of the 2005 test, for example, might depend in part upon Chinese language ability and the rhetorical skills needed to write a persuasive essay rather than general English ability. Moreover, sentence level translation exercises have been criticized for drawing heavily upon skills only partly related to target language use (Connor & Kaplan, 1986, p. 9-21).
"The fact that Listening section of the 2005 test correlated negatively with the Reading and Vocabulary sections should raise the eyebrows of any researcher."

The third research finding concerned the Listening section in 2005 test. The fact that Listening section of the 2005 test correlated negatively with the Reading and Vocabulary sections should raise the eyebrows of any researcher. A possible reason for this is listening section measure some abilities which are quite different from the ones for Reading and Vocabulary sections.

2. Recommendations for future tests

Test development is cyclical, not linear (McNamara, 2000, p. 23). That is, once a test is designed, constructed, trialed and operationalised its actual use generates evidence about its qualities (McNamara, 2000, p. 32). There are still some weaknesses with 2005 test. In that light, the following three proposals are offered:

[ p. 9 ]

  1. The Cloze section needs to have a have a wider response format which includes integrated and interactive test items rather than solely multiple-choice items. By incorporating a wider range of tasks and response formats, more skills can be tested and hence the score can measure what it's supposed to measure.
  2. Since 2005 test has a quite low percentage of appropriate items, by conducting piloting and/or pre-testing the ID and IF levels could be raised. That is, by having a system by which the right statistical procedures are followed, items which "misfit" or perform poorly would automatically be deleted. A Rasch analysis could be employed to do this.
  3. Listening section in 2005 test needs to be improved. The validity needs to be investigated further. The low or even negative correlation draws our attention.

3. Limitations and implications for further research

3.1. Limitations

The main limitation in this study involves the scoring reliability of the Writing section of each exam. The writing section was scored by the author. The standard procedure is to employ two indepedent raters average their scores. Another limitation is that this study utilized only classical measurement theory procedures. More sophisticated forms of data analysis incorporating procedures based on item response theory could also shed valuable light on this data. Further studies of the CASEEEDC based on Rasch theory would be illuminating.

3.2. Implications

Although this research is preliminary, it has four practical implications. First of all, it points out the need to enhance the item discrimination and item facility ratings for the CASEEEDC. The 2005 CASEEEDC had a low percentage of acceptable items in regard to ID and IF. In particular, the listening, reading and translation sections need improvement.

Second, this study points out the need for a closer examination of the Listening section of the 2005 test. The average mean score for this section was 13.2 and Question 1 of the second questionnaire indicates most respondents felt that this section was too easy.

Third, this study suggests the need for a different response format in the cloze section. The cloze section of 1986 test, which used a blanking-filling format, had a much higher number of acceptable items than the 2005 test, which used a multiple-choice format. The 2005 Cloze Section had a lower correlation with the total score than the 1986 test. The cloze section of the 1986 test had the highest correlation with the total score among all subtests, which suggests that the fill-in-the-blank format may be superior to the MC format in some ways.

Fourth, this study also highlights the need for qualitative feedback on the exam. In particular, a well-triangulated analysis by students, teachers, and test developers of what constructs they believe this exam taps into and what they consider to be some of the biases inherent in the exam would shed valuable light on not only the way the exam is structured, but also the exam content.

Acknowledgements

We would like to thank Professor Li Xiaodi for providing the 1986 version of the CASSSEDC. In addition, help was received from two classes of M.S. students at the Chinese Academy of Sciences for taking two versions of the CASSSEDC and completing the surveys that informed this study.

[ p. 10 ]

References

Alderson, J. C., Clapham, C. & Dianne, W. (2000). Language testing construction and evaluation. Cambridge: Cambridge University Press.

Bachman, L. F. (1990). Fundamental considerations in language testing. Oxford: Oxford University Press.

Bachman, L.F. (2004). Statistical analyses for language assessment. Cambridge: Cambridge University Press.

Brown, J.D. (1995b). Developing norm-referenced language tests for program-level decision making. In J. D. Brown and S. O. Yamashita (Eds.) Language Testing in Japan. pp. 40-47. Tokyo: Japan Association for Language Teaching.

Clapham, C. (1996). The development of IELTS: A study of the effect of background knowledge on reading comprehension. Cambridge: Cambridge University Press.

Connor, U. & Kaplan, R. B. (Eds.). (1986). Writing across languages: Analysis of L2 text (pp. 9-21). Reading, MA: Addison-Wesley.

Ebel, R. L & Frisbie, D. A.(1991). Essentials of educational measurement. Englewood Cliffs, NJ: Prenctice-Hall.

Heaton, J. B. (2000). Writing English language tests. Longman Group UK Limited.

Henning, G. (2003). A guide to language testing: Development, evaluation and research. Singapore: Heinle & Heinle/Thomson Learning Asia.

Hughes, A. (2004). Testing for language teachers. Cambridge: Cambridge University Press.

McNamara, T. (2000). Language testing. Oxford: Oxford University Press.

Morgan, G.A., Griege, O. V. & Gloeckner, G.W. (2001). SPSS for Windows: An introduction to use and interpretation in research. Mahwah, New Jersey: Lawrence Erlbaum Associates.

Salmani-Nodoushan, M. A. (2003). Text familiarity, reading tasks and ESP test performance: A study on Iranian LEP and non-LEP university students. The Reading Matrix, 3 (1), 1-14.

Wall, M. & Murphy-Boyer, L. (2002, September 6). Some issues concerning the use of multiple-choice items to assess student performance. Accessed on November 18, 2006 at http://www.mcmaster.ca/cll/stlhe2002new/HTML/notes/wall.html.

Yang, H. & Weir, C. (1998). Validation study of the National College English Test. Shanghai: Shanghai Foreign Language Education Press.

Main Article Appendix A Appendix B Appendix C Appendix D Appendix E

Newsletter: Topic IndexAuthor IndexTitle IndexDate Index
Main Page Background Links Network Join
last Main Page next
http://jalt.org/test/jz_1.htm

[ p. 11 ]